Eview HB56 Update Rate, Latency and Jitter: Septentrio mosaic-X5 Test Data
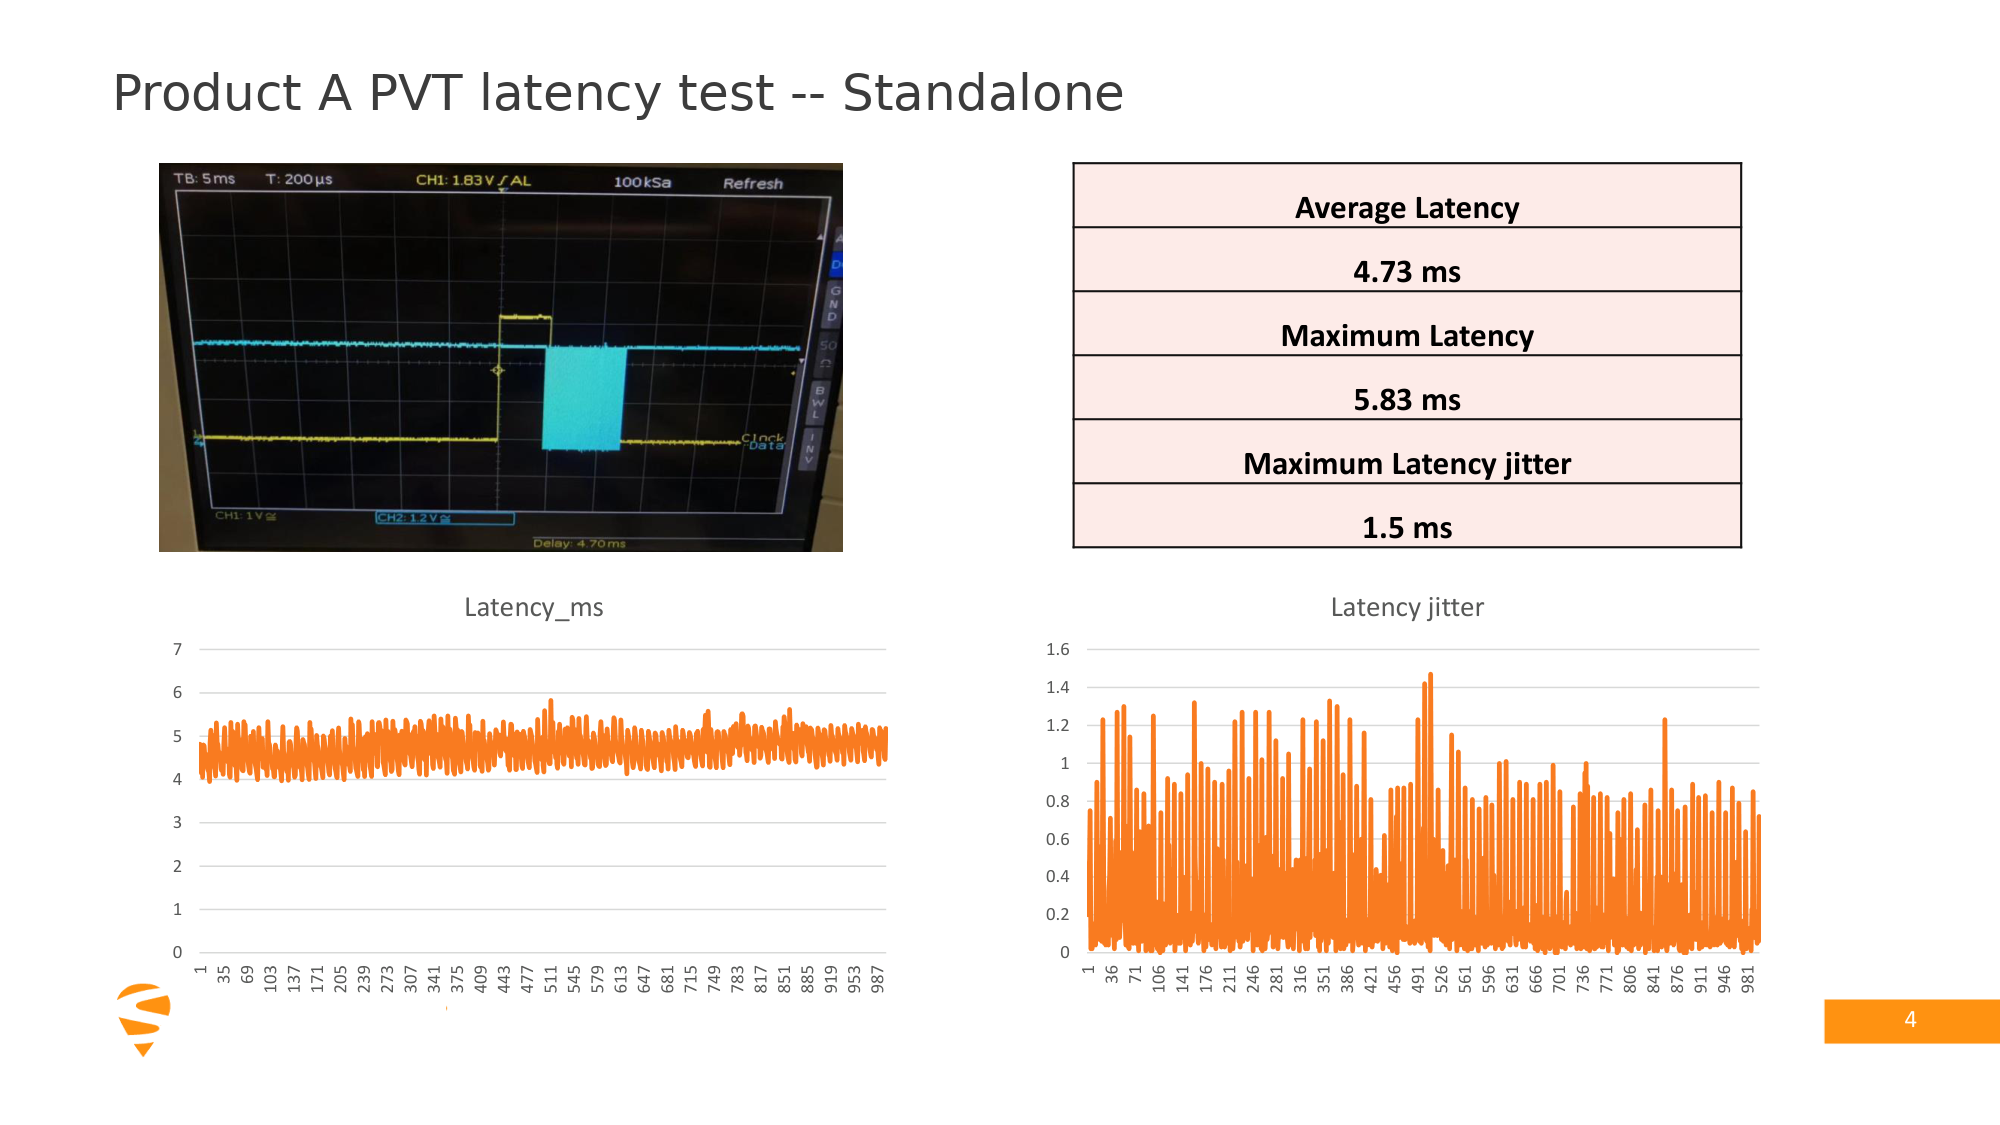
How fast does the Eview HB56 output its position? The HB56 is built on the Septentrio mosaic-X5 GNSS engine. In Septentrio’s three test campaigns covering seven receivers, the mosaic-X5 (recorded as Product A) had the lowest output latency and jitter of all: 4.41–4.73 ms average latency and under 1.5 ms maximum jitter, against 11.6–113 ms average latency for the other receivers. It also supports position output at up to 100 Hz.
Quick answer: The Eview HB56 uses the Septentrio mosaic-X5 engine, which in Septentrio’s tests delivered position in under 5 ms on average (4.41 ms in RTK, 4.73 ms standalone) with maximum jitter under 1.5 ms, at up to 100 Hz. The other receivers tested averaged 11.6–113 ms.
Summary
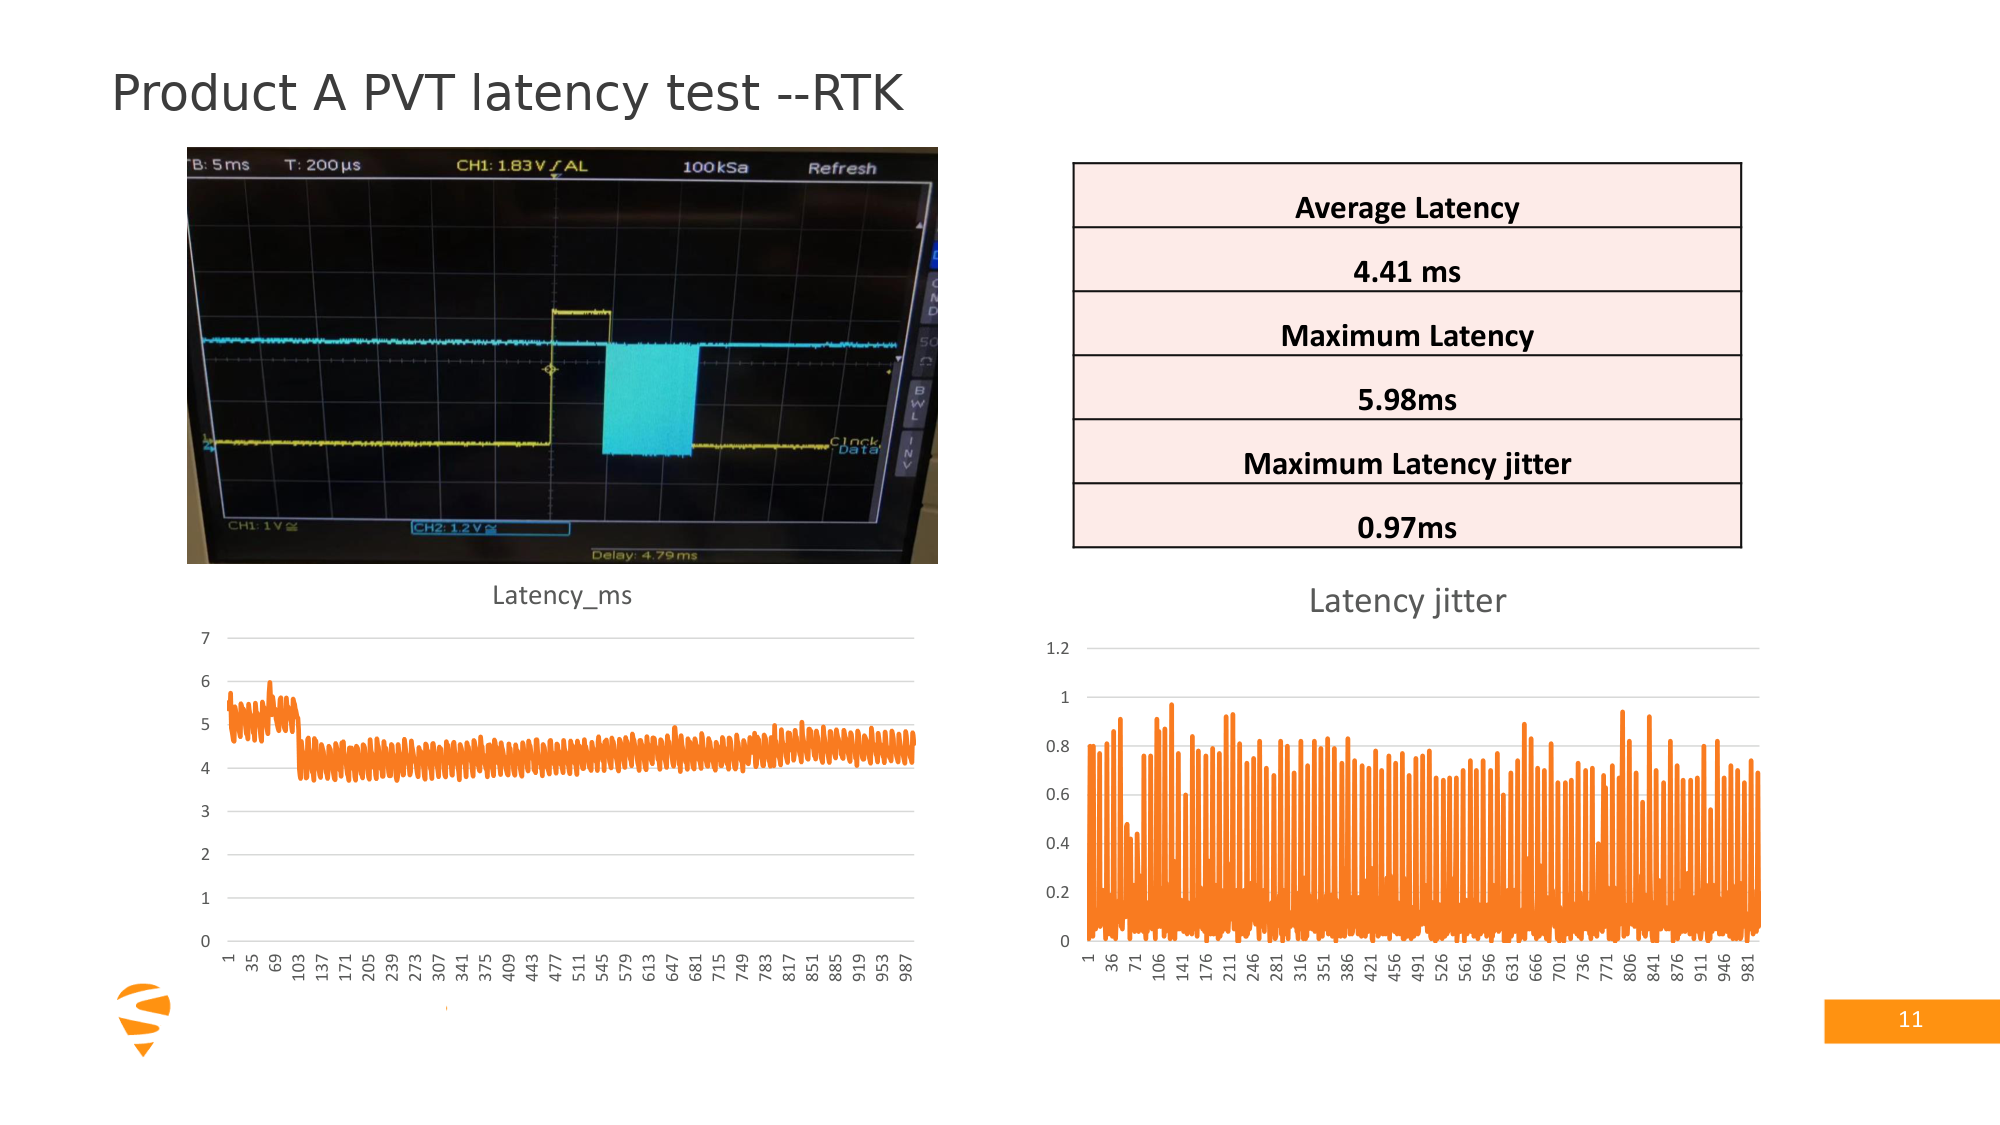
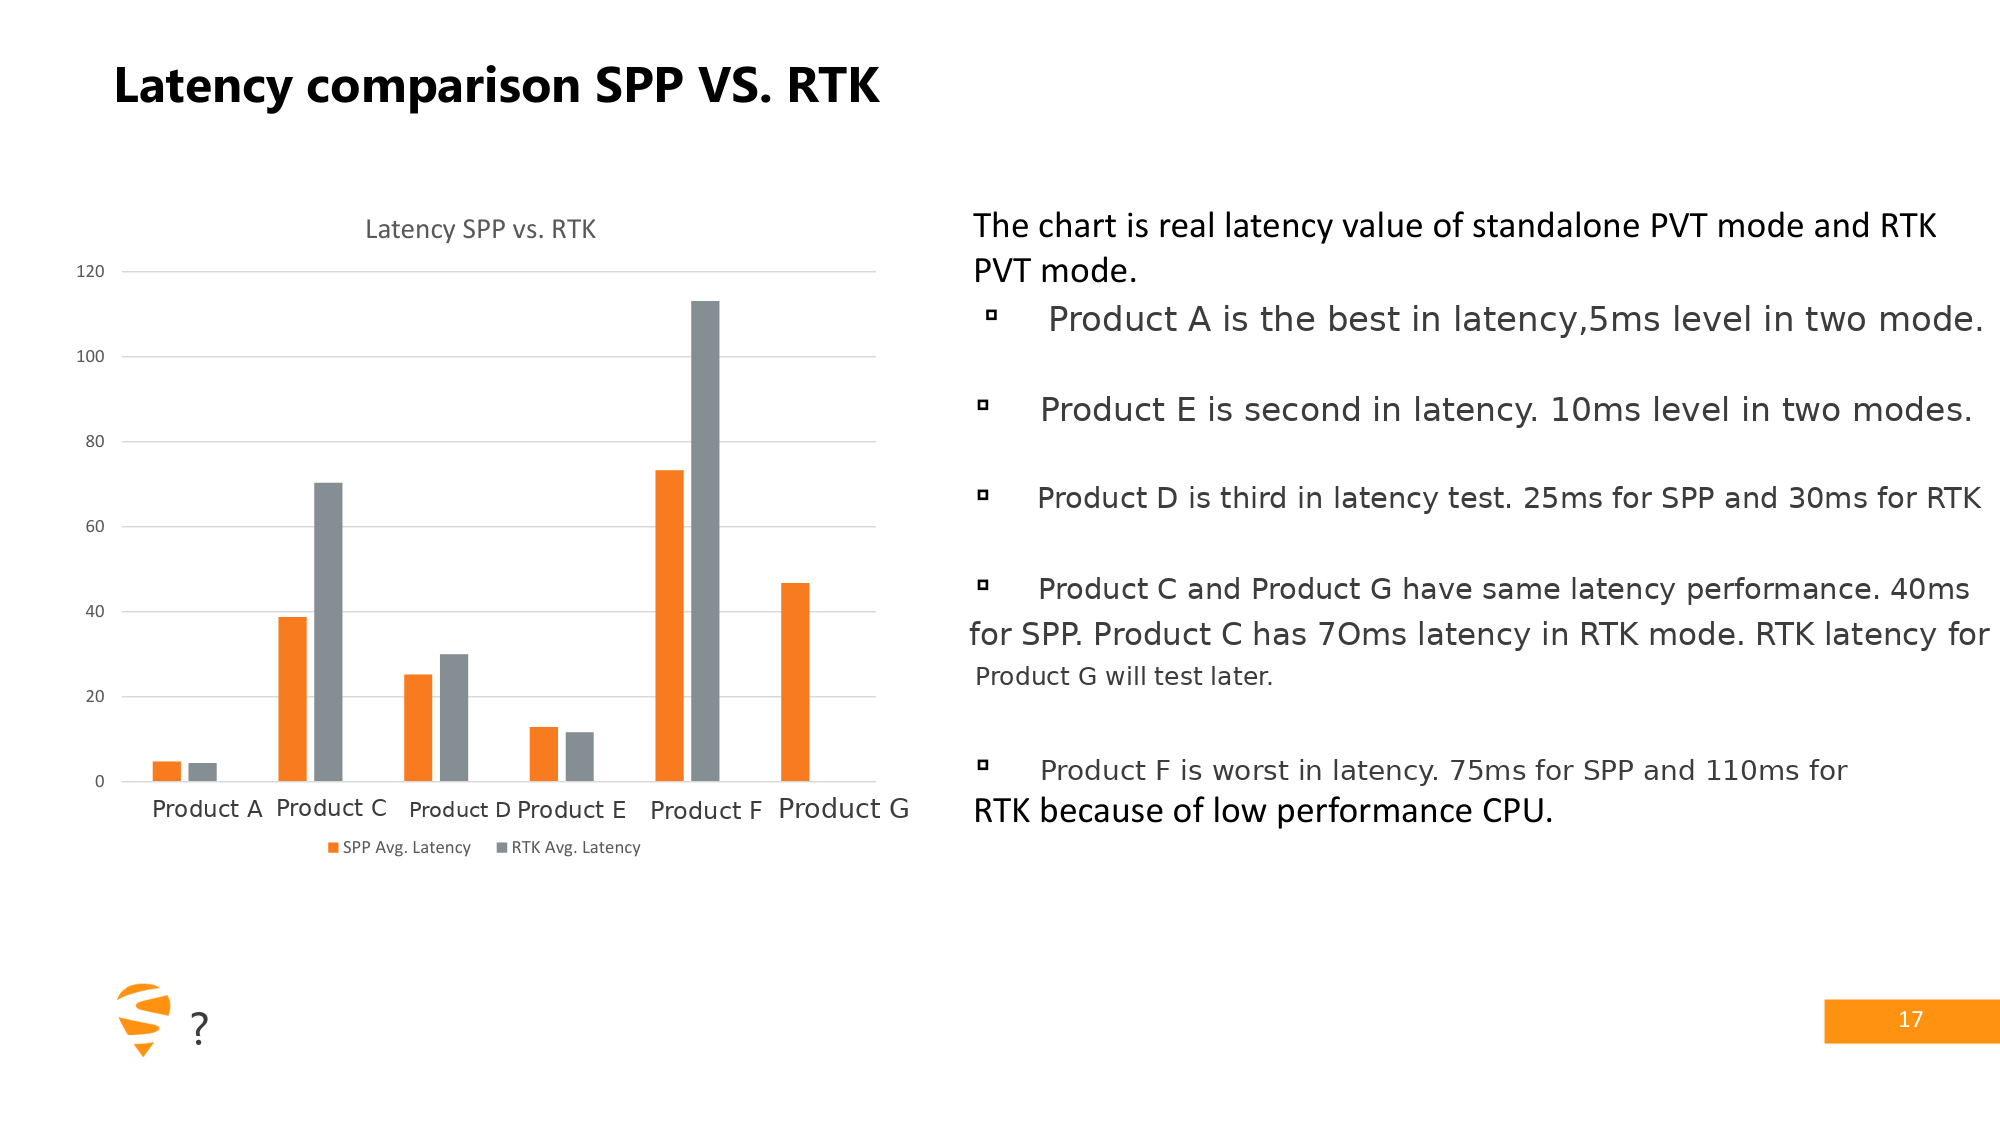
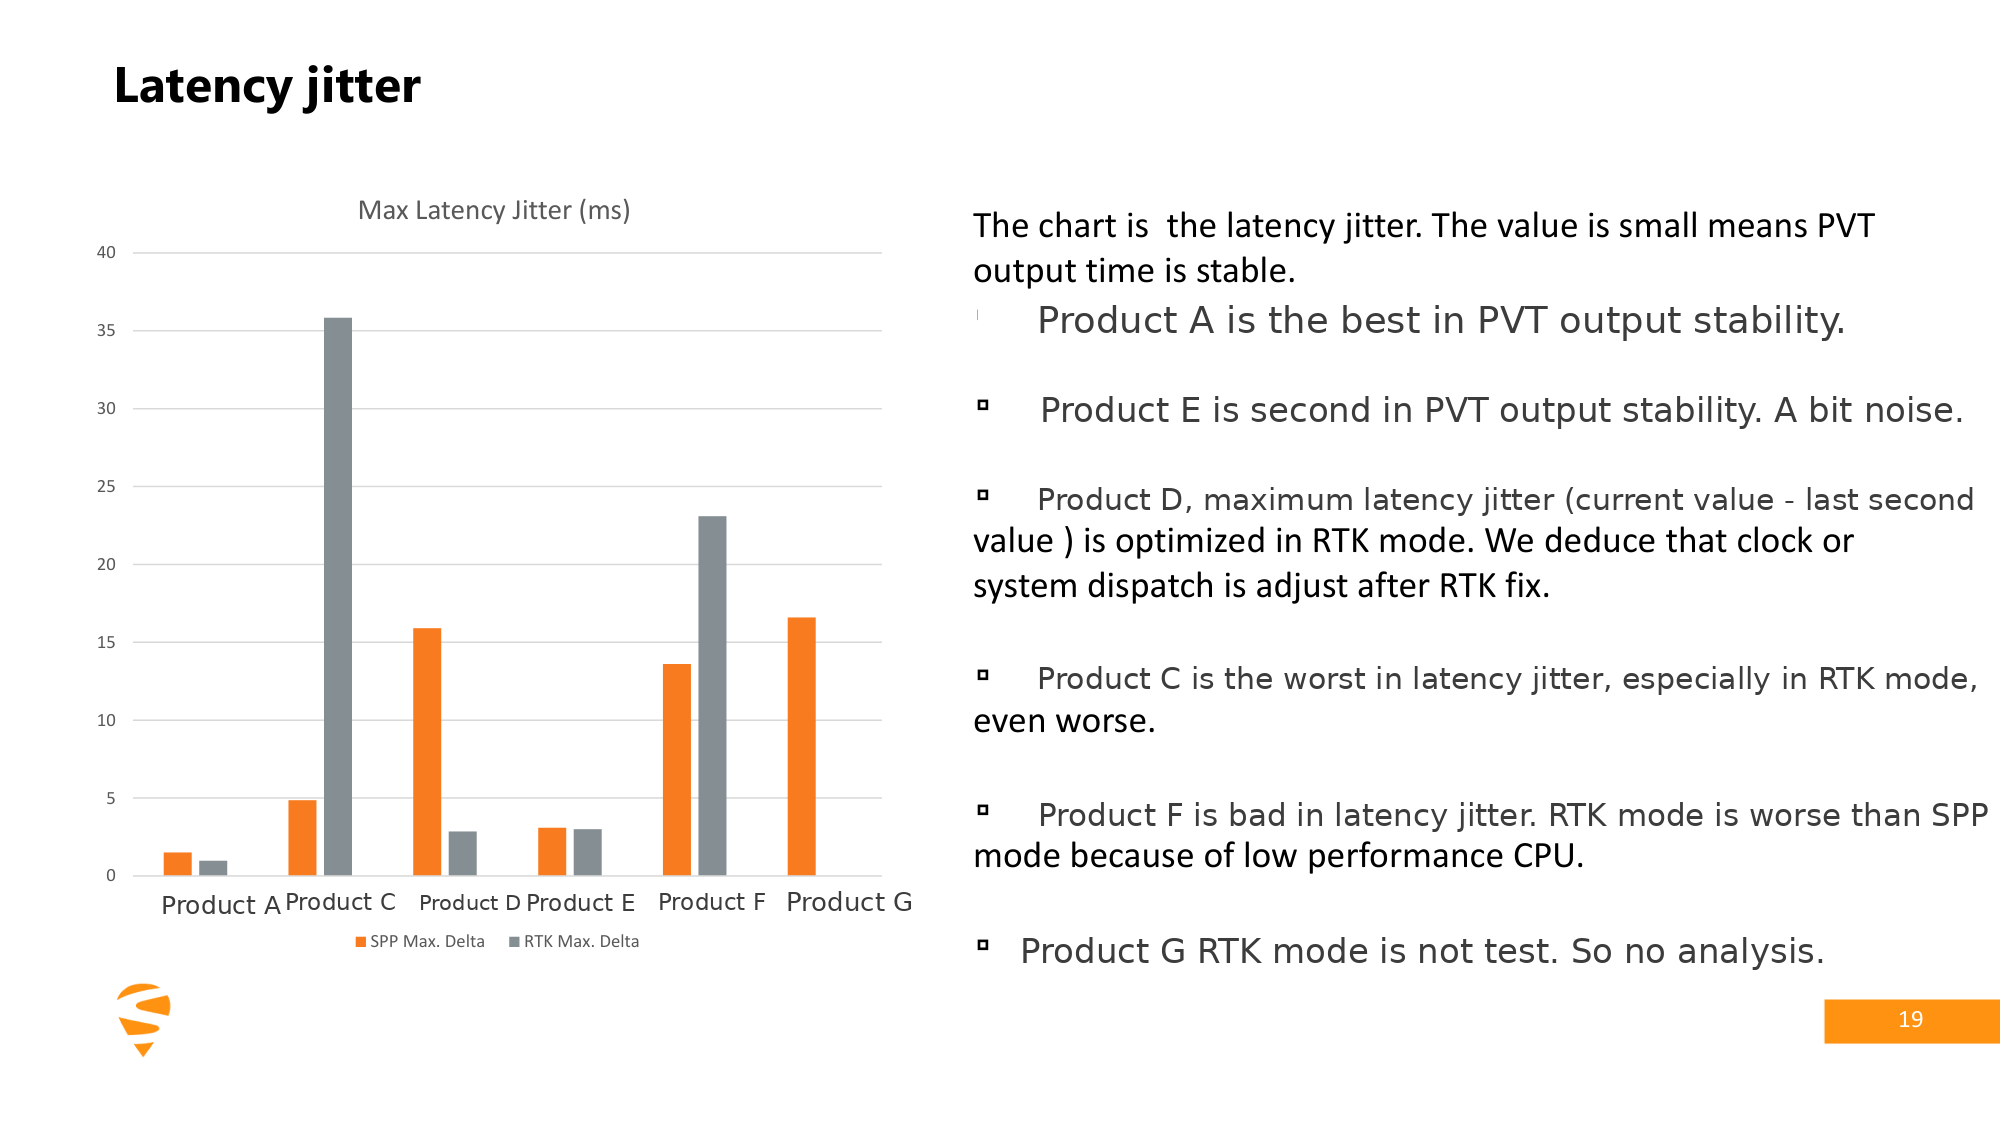
On output latency and jitter, the mosaic-X5 engine inside the HB56 (Product A) averaged 4.73 ms in standalone (SPP) mode and 4.41 ms in RTK mode, with maximum latency values of 5.83 ms and 5.98 ms and maximum jitter of 1.5 ms and 0.97 ms respectively — the lowest of any receiver tested.
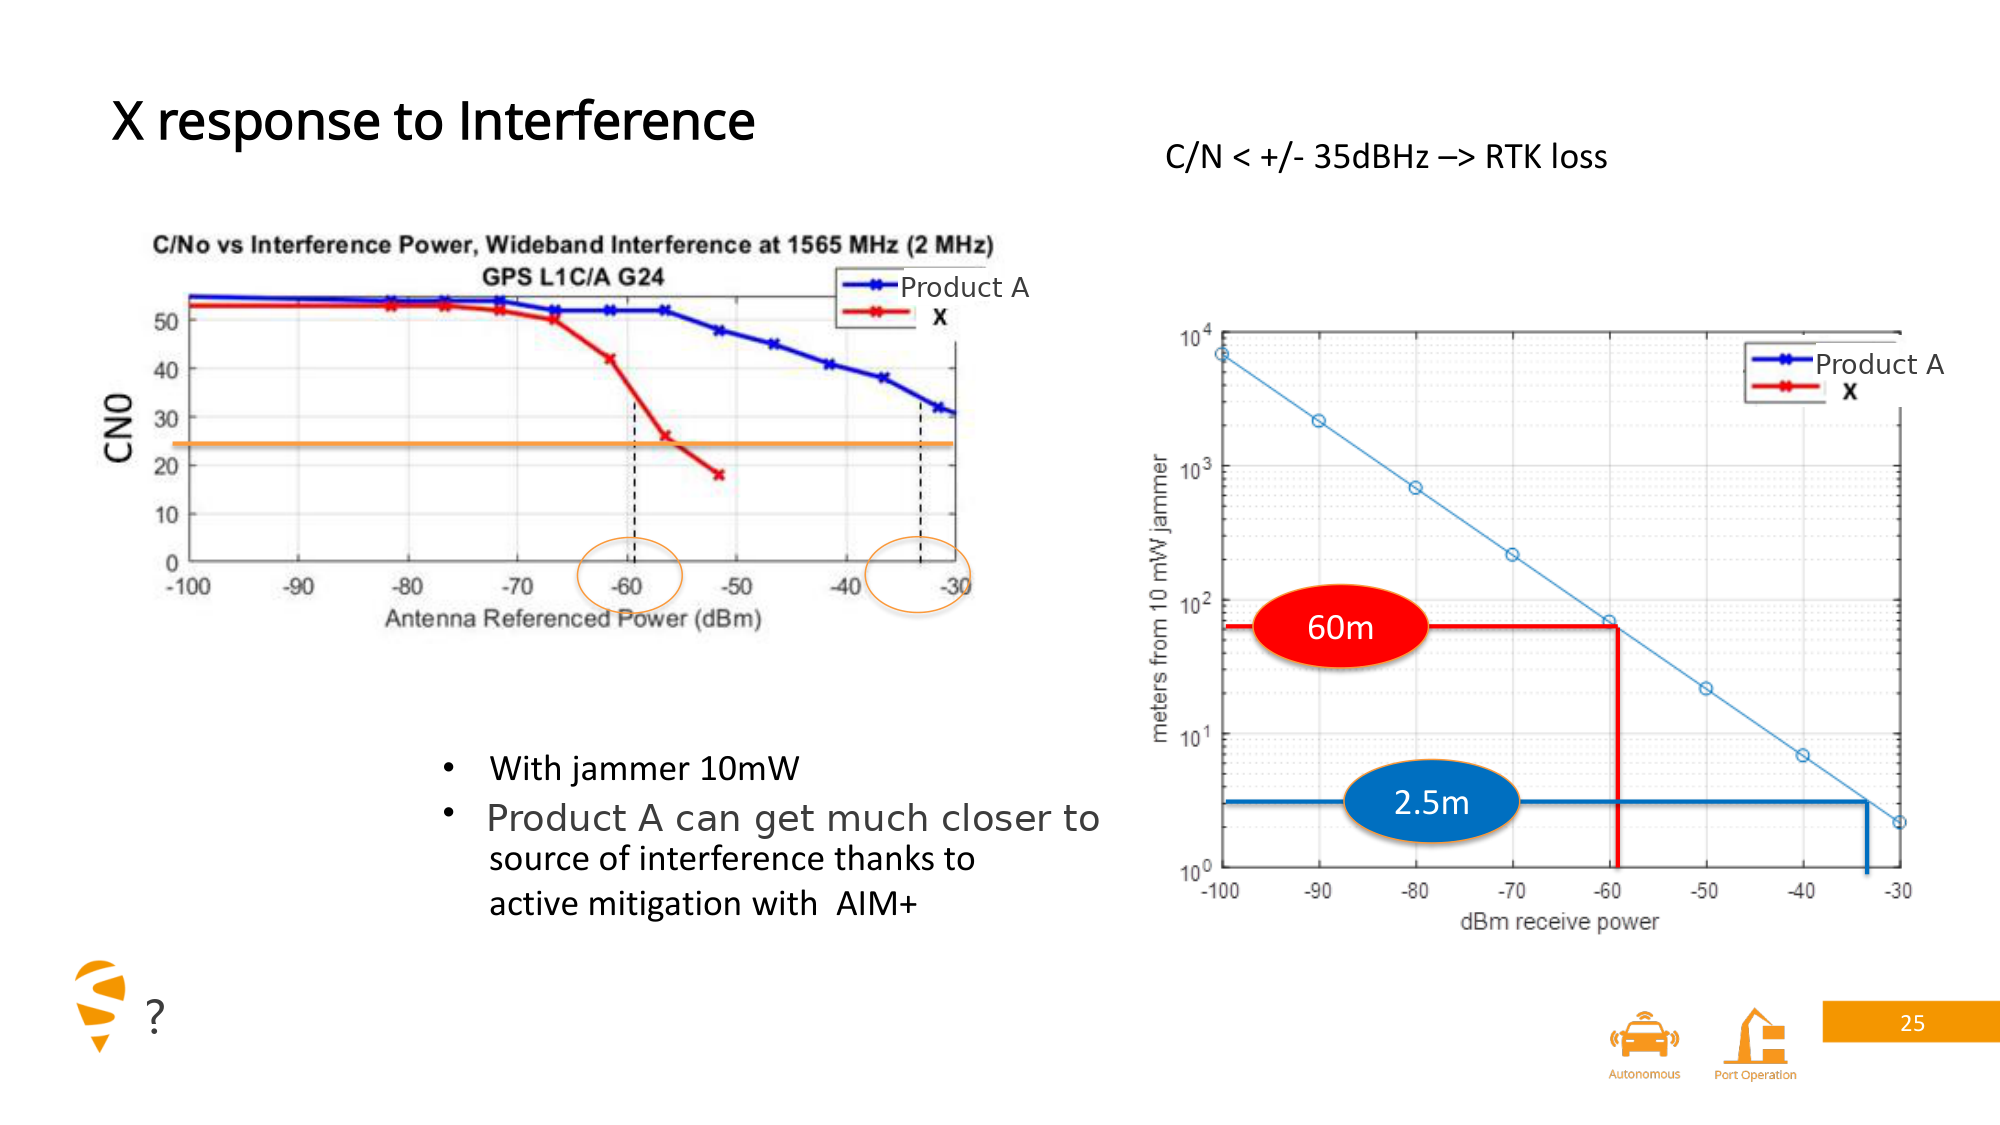
On update rate, Product A supported output up to 100 Hz. On static and dynamic reliability, it outperformed the other receivers in the same batch on RTK availability, error-reporting consistency, resistance to shock and vibration, and interference rejection.
1. PVT Output Latency and Jitter: Measured Results
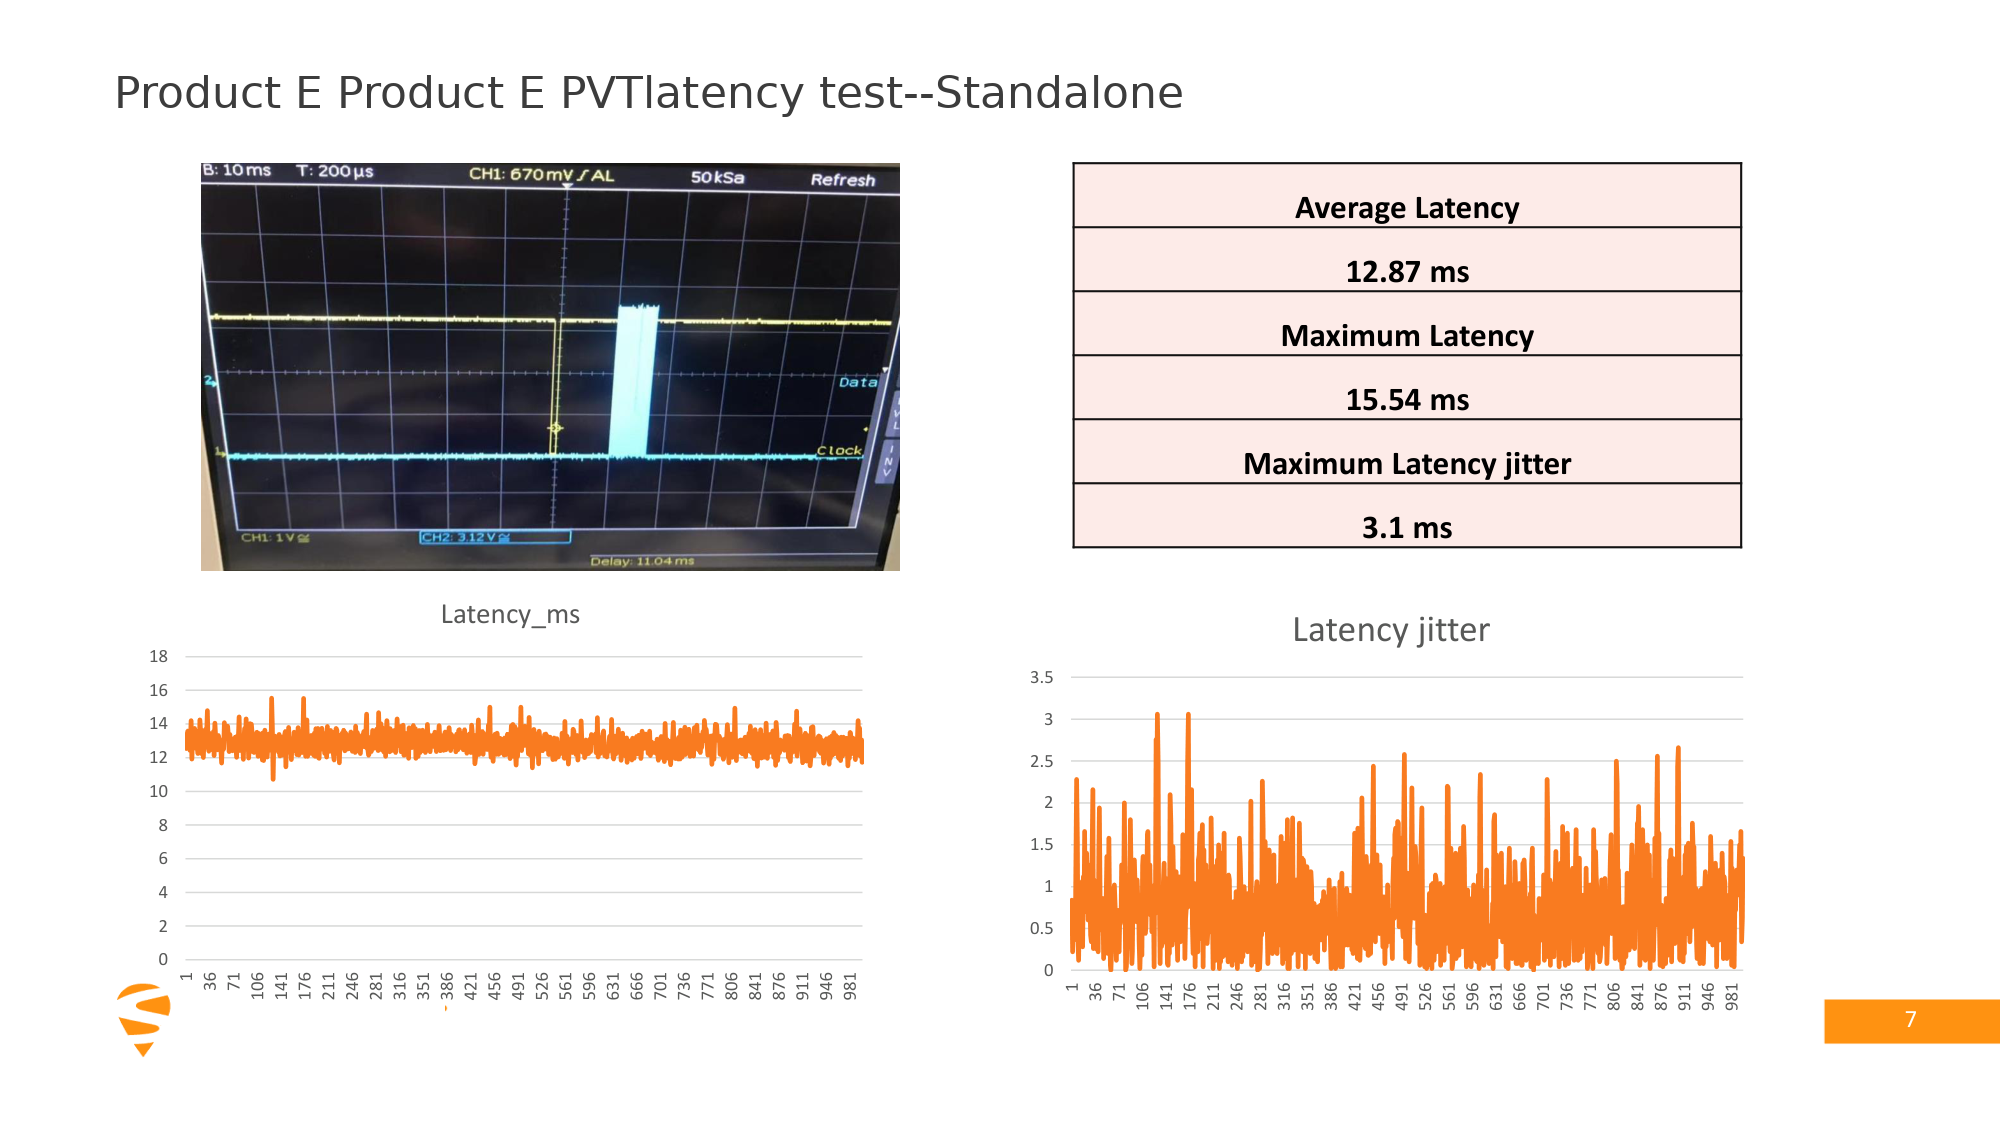
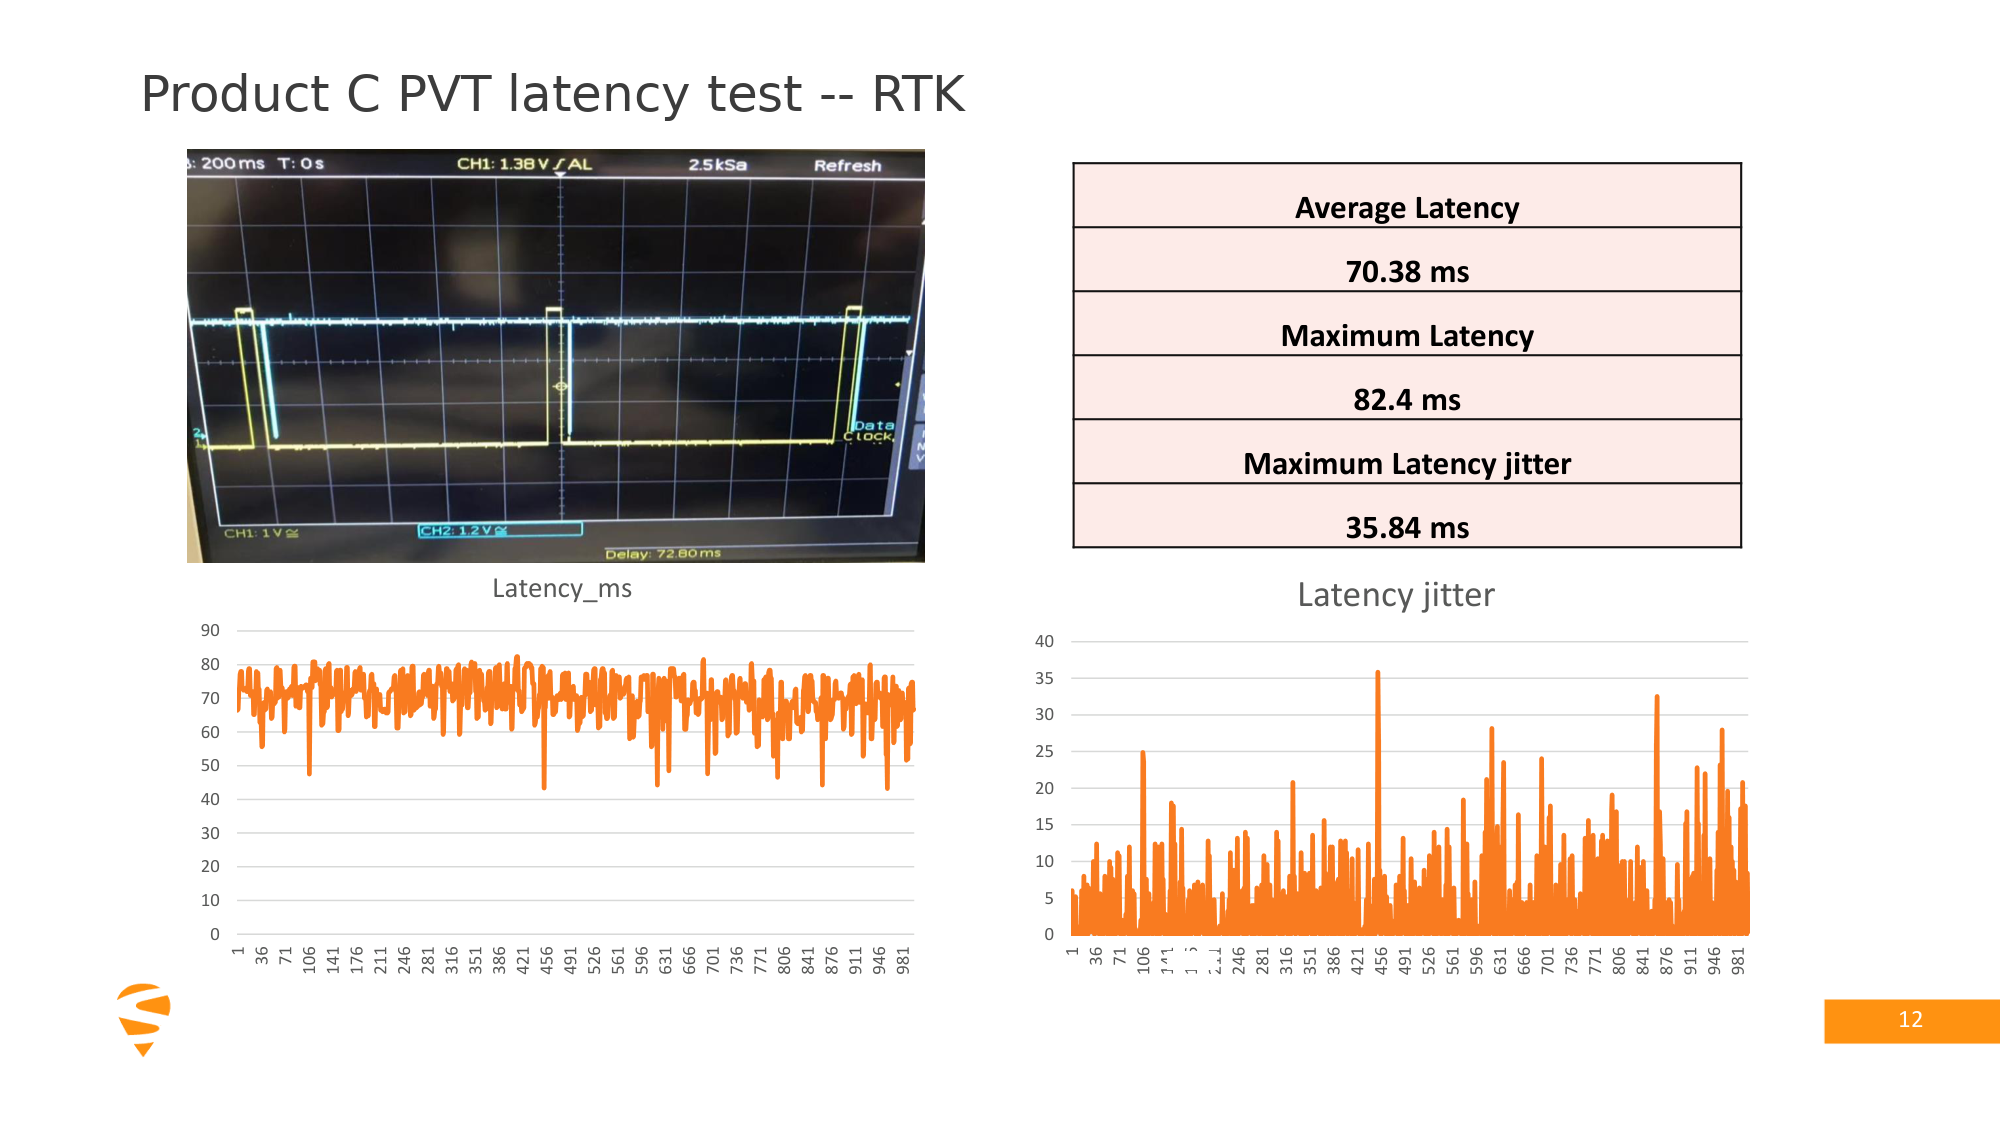
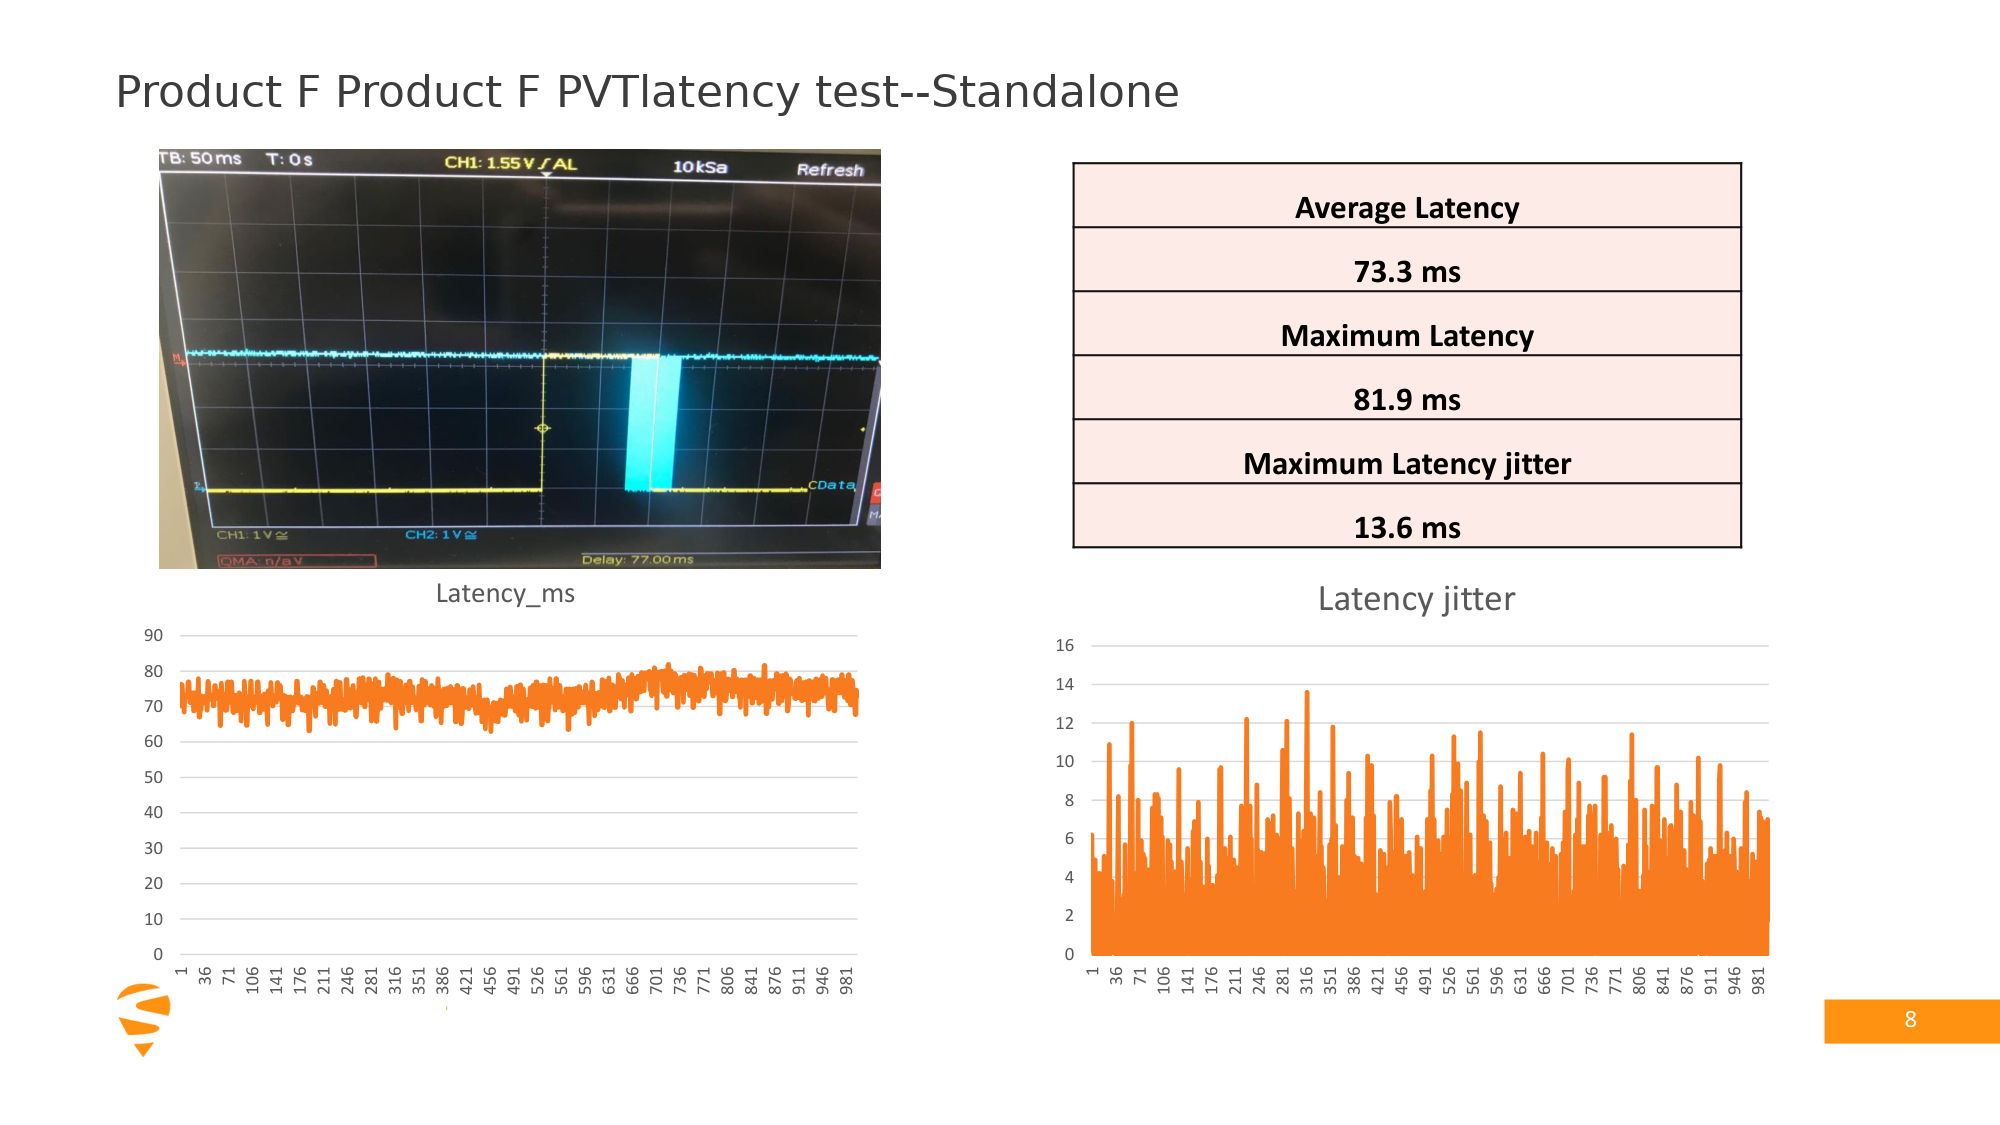
The table below summarises average latency, maximum latency and maximum jitter for every receiver in the campaign, in both SPP and RTK modes.
| Receiver | Average latency SPP / RTK (ms) | Maximum latency SPP / RTK (ms) | Maximum jitter SPP / RTK (ms) |
|---|---|---|---|
| Product A (mosaic-X5, the engine in the Eview HB56) | 4.73 / 4.41 | 5.83 / 5.98 | 1.5 / 0.97 |
| Product C | 38.75 / 70.38 | 42.4 / 82.4 | 4.86 / 35.84 |
| Product D | 25.25 / 30.01 | 41.43 / 32.64 | 15.9 / 2.86 |
| Product E | 12.87 / 11.64 | 15.54 / 13.92 | 3.1 / 3.0 |
| Product F | 73.3 / 113.15 | 81.9 / 136.6 | 13.6 / 23.1 |
| Product G | 46.77 / — | 61.96 / — | 16.6 / — |
Note: Product G was not tested in RTK mode.
2. Static and Dynamic Reliability, Vibration and Interference
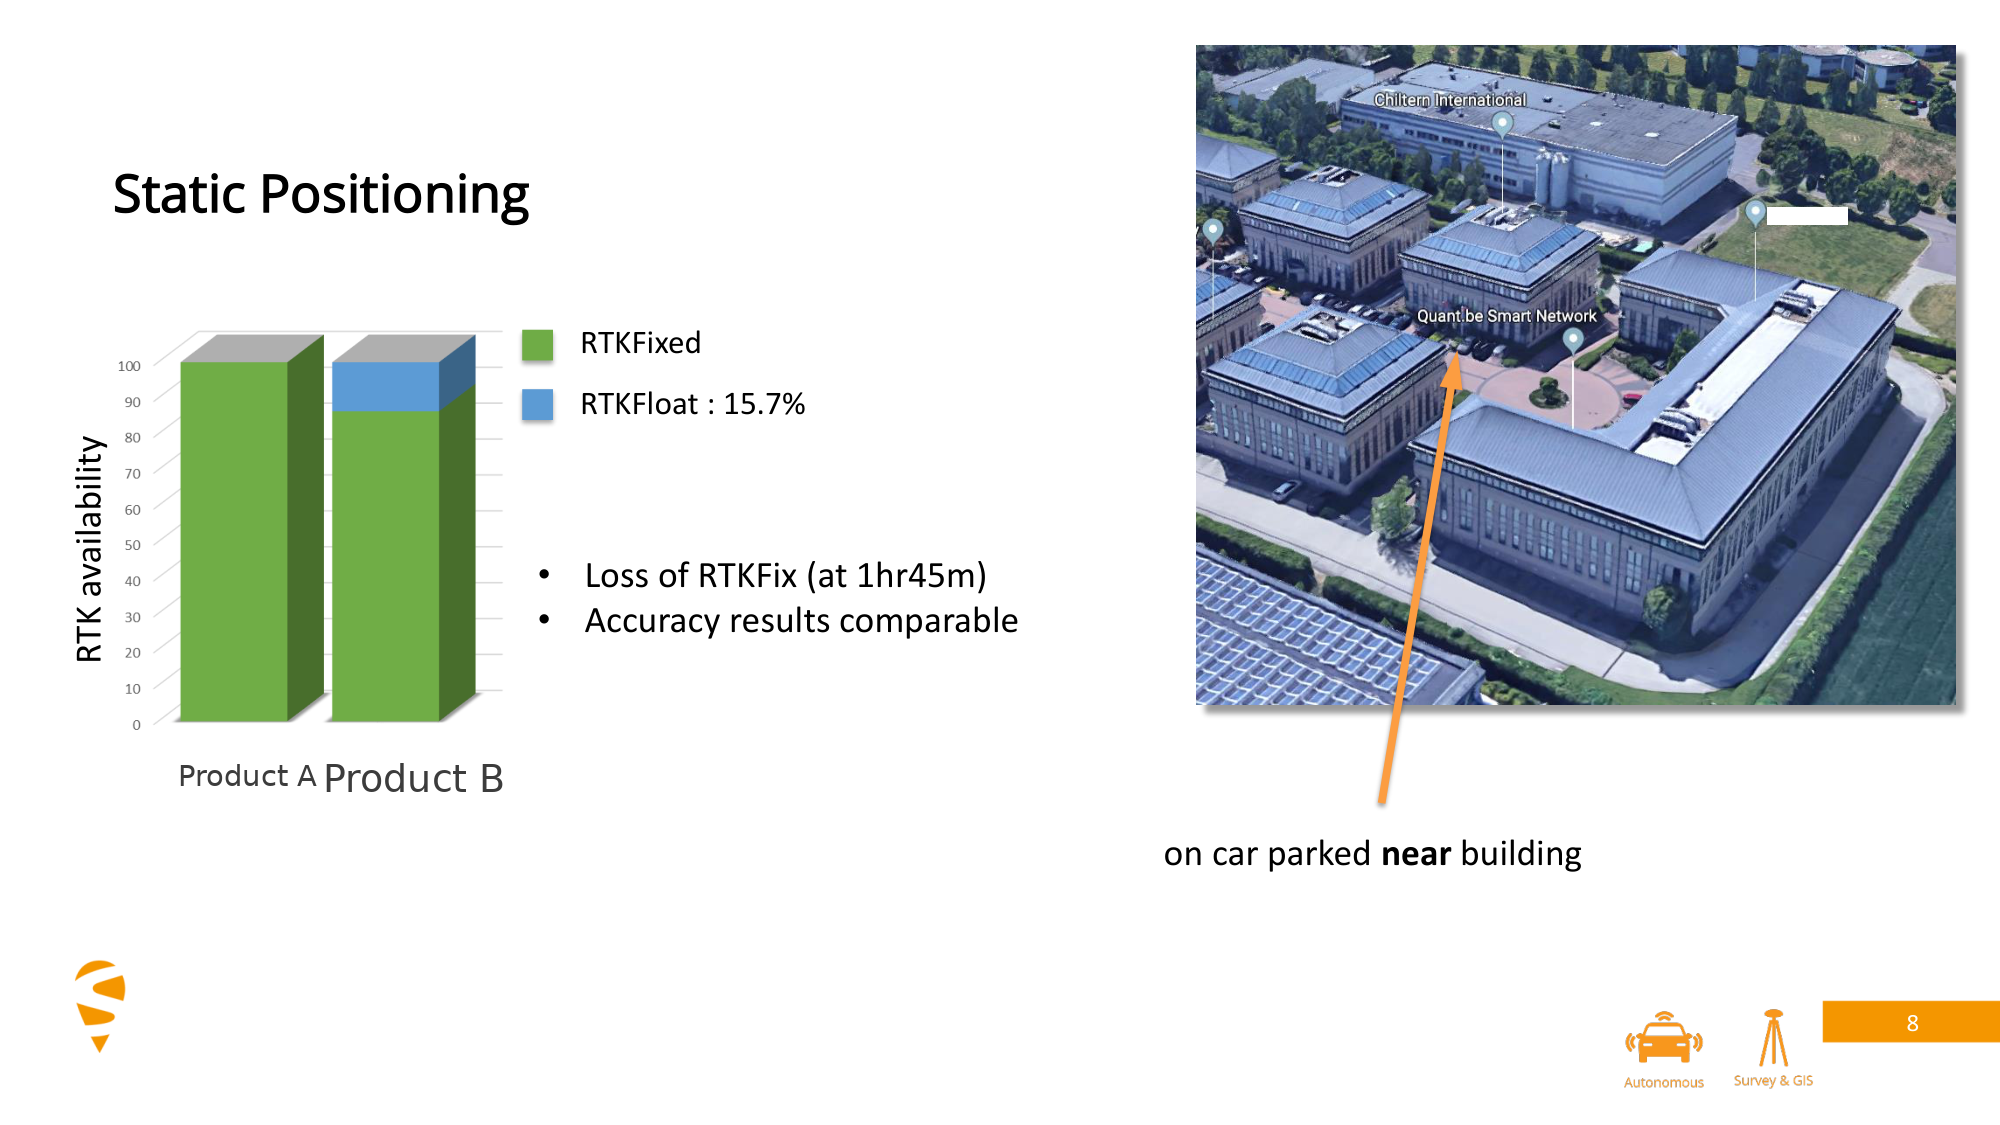
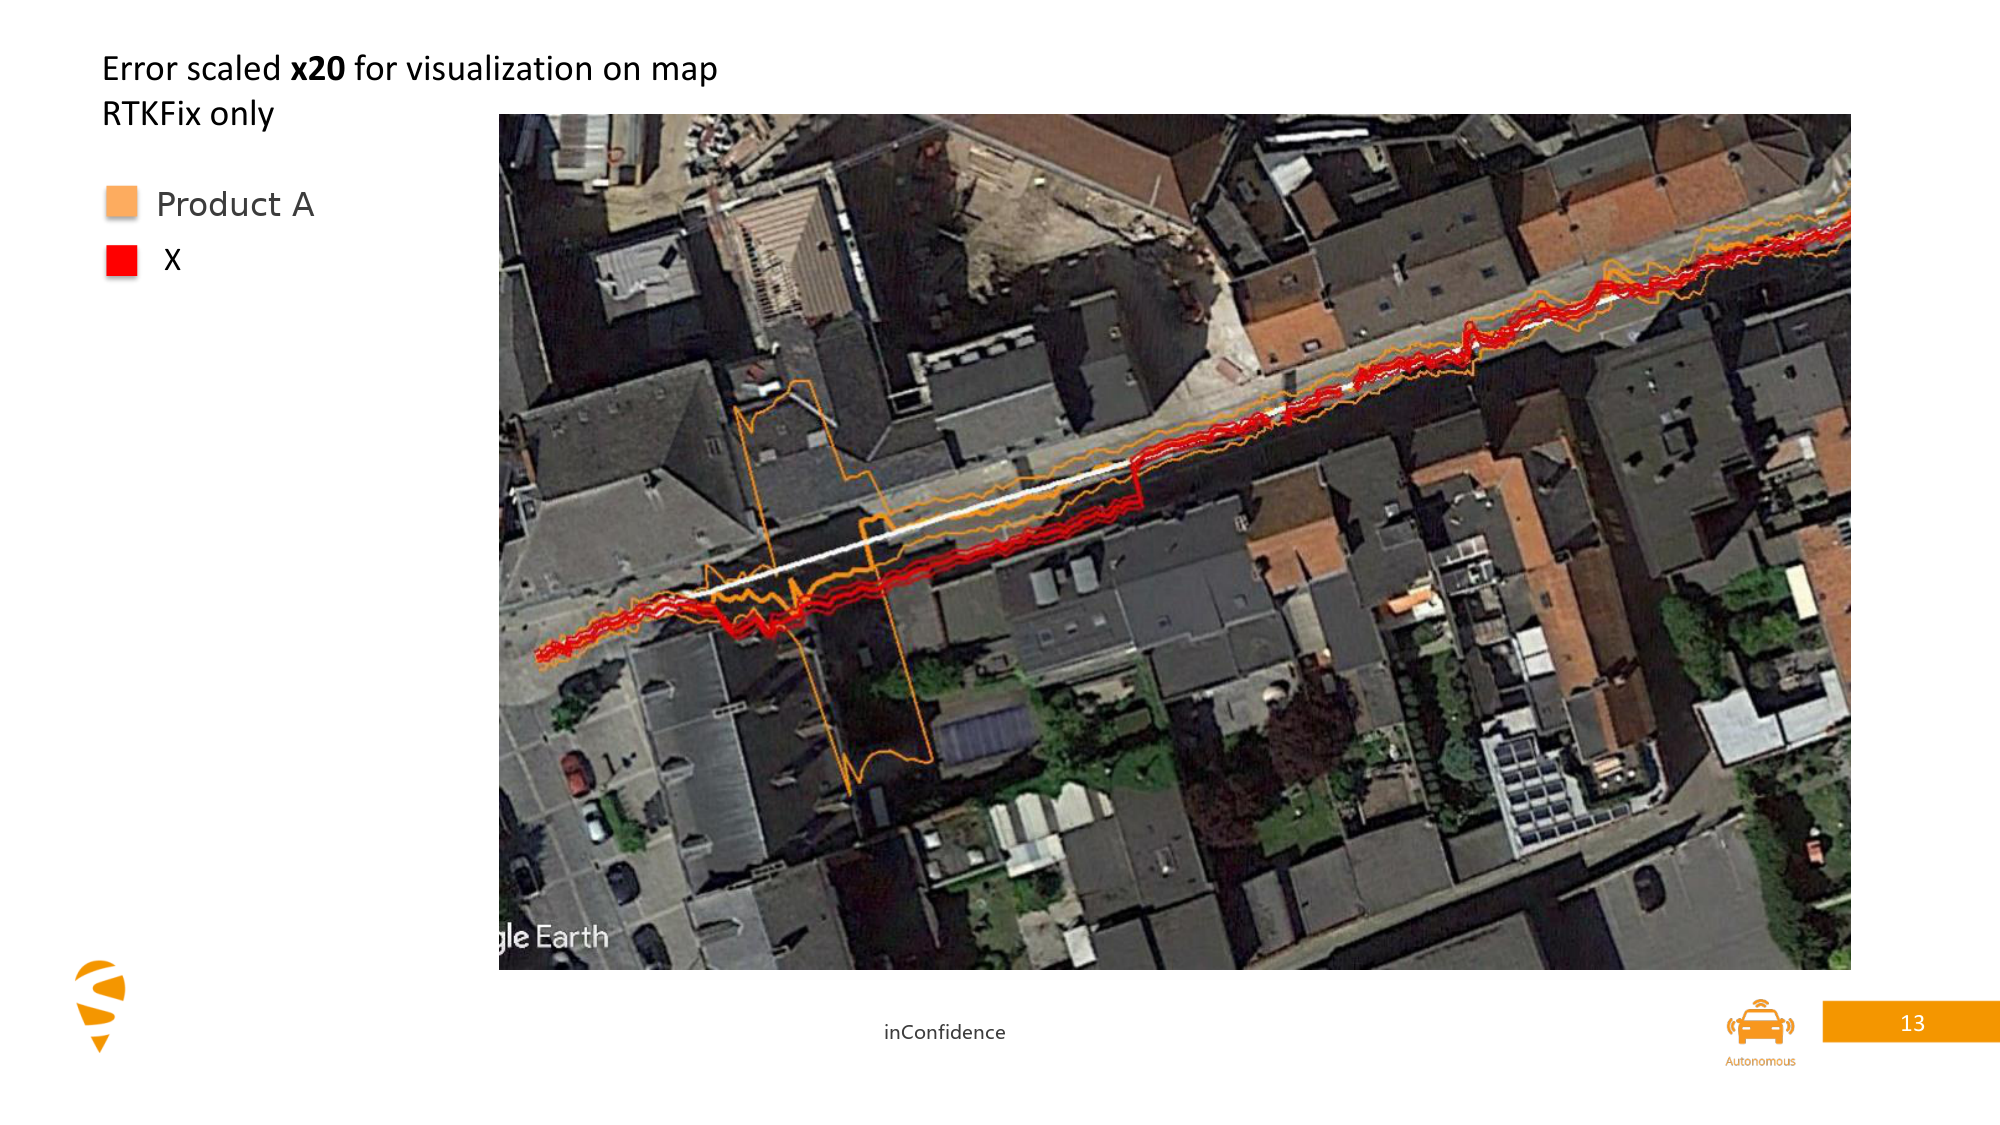
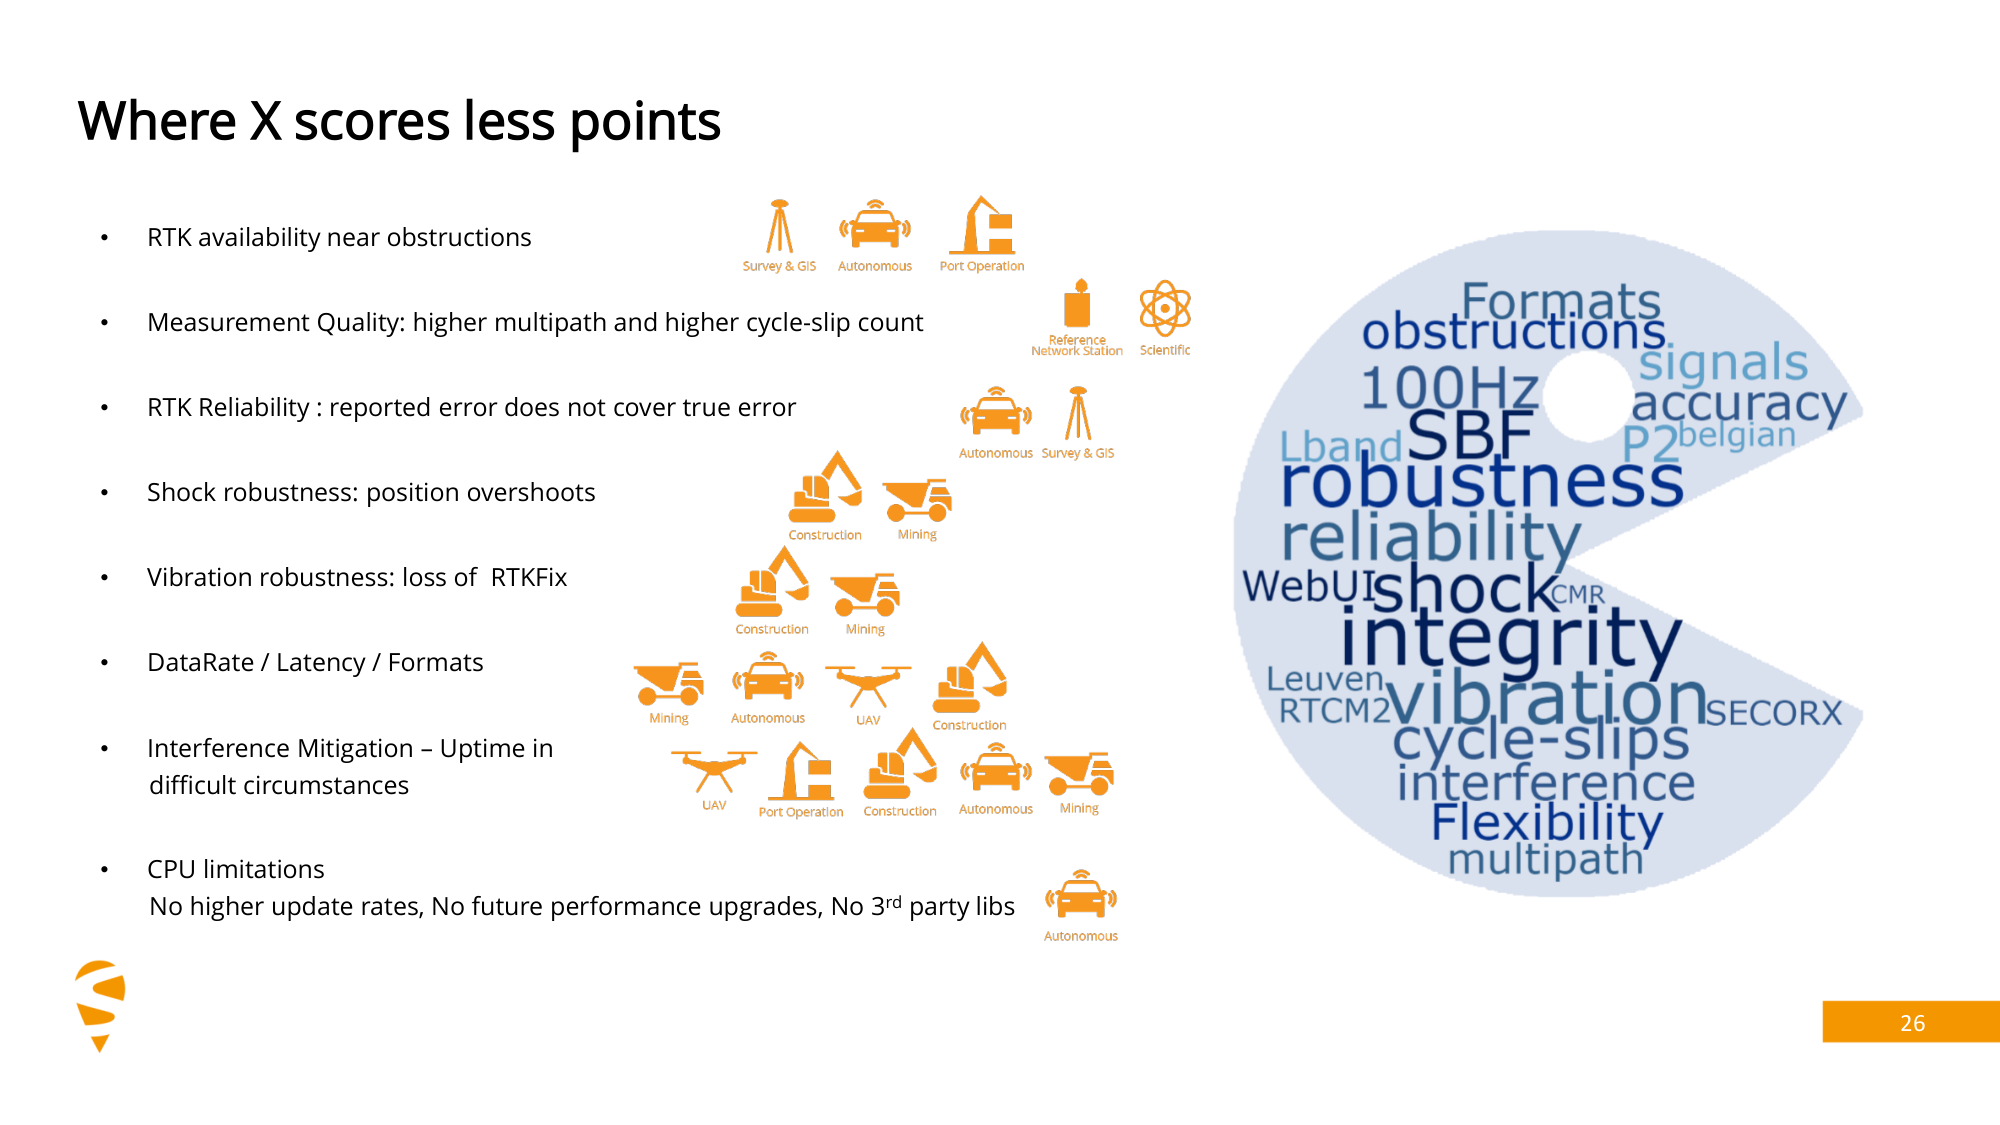
This section covers the static and dynamic reliability baseline: RTK availability between buildings, urban dynamic error trajectory, behaviour under shock and vibration, and carrier-to-noise ratio under rising interference power.
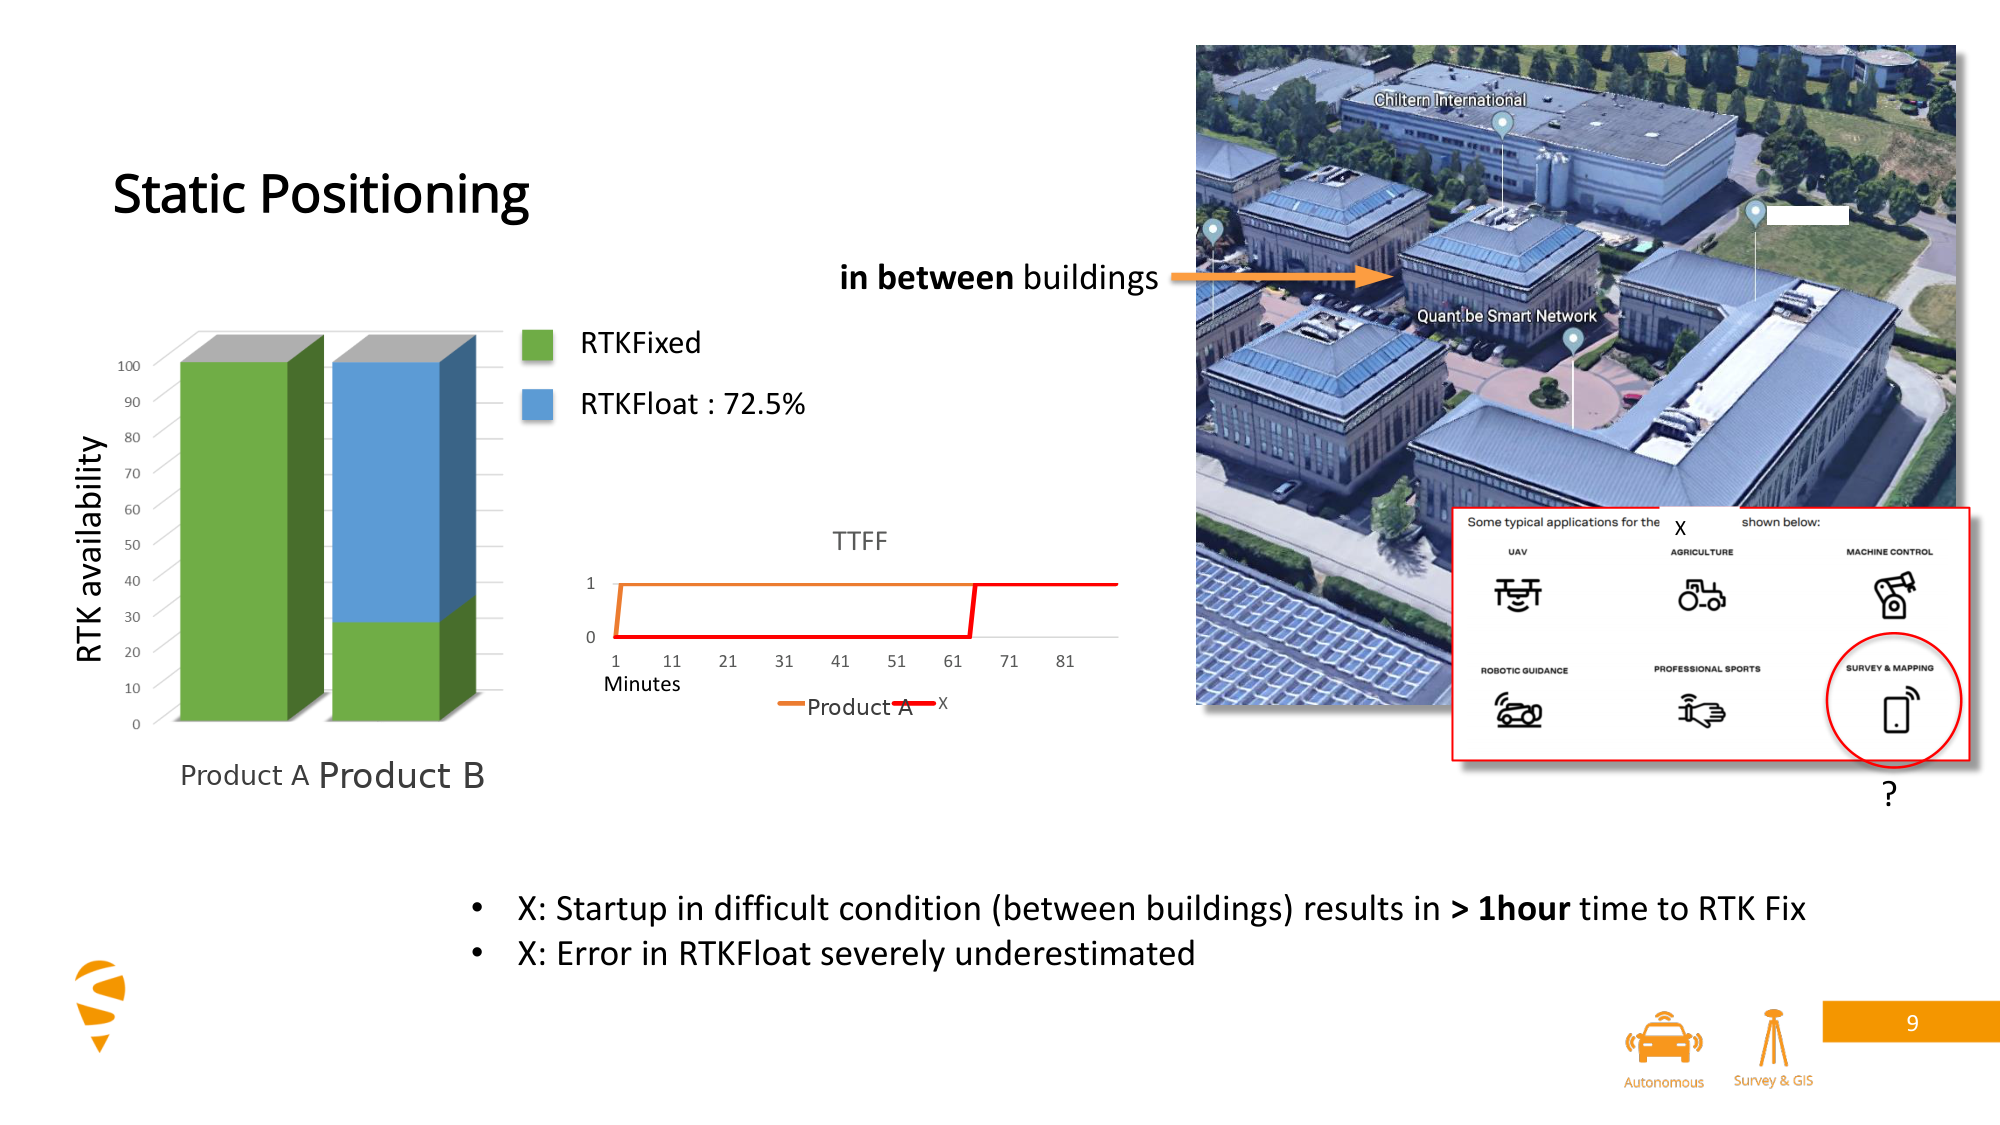
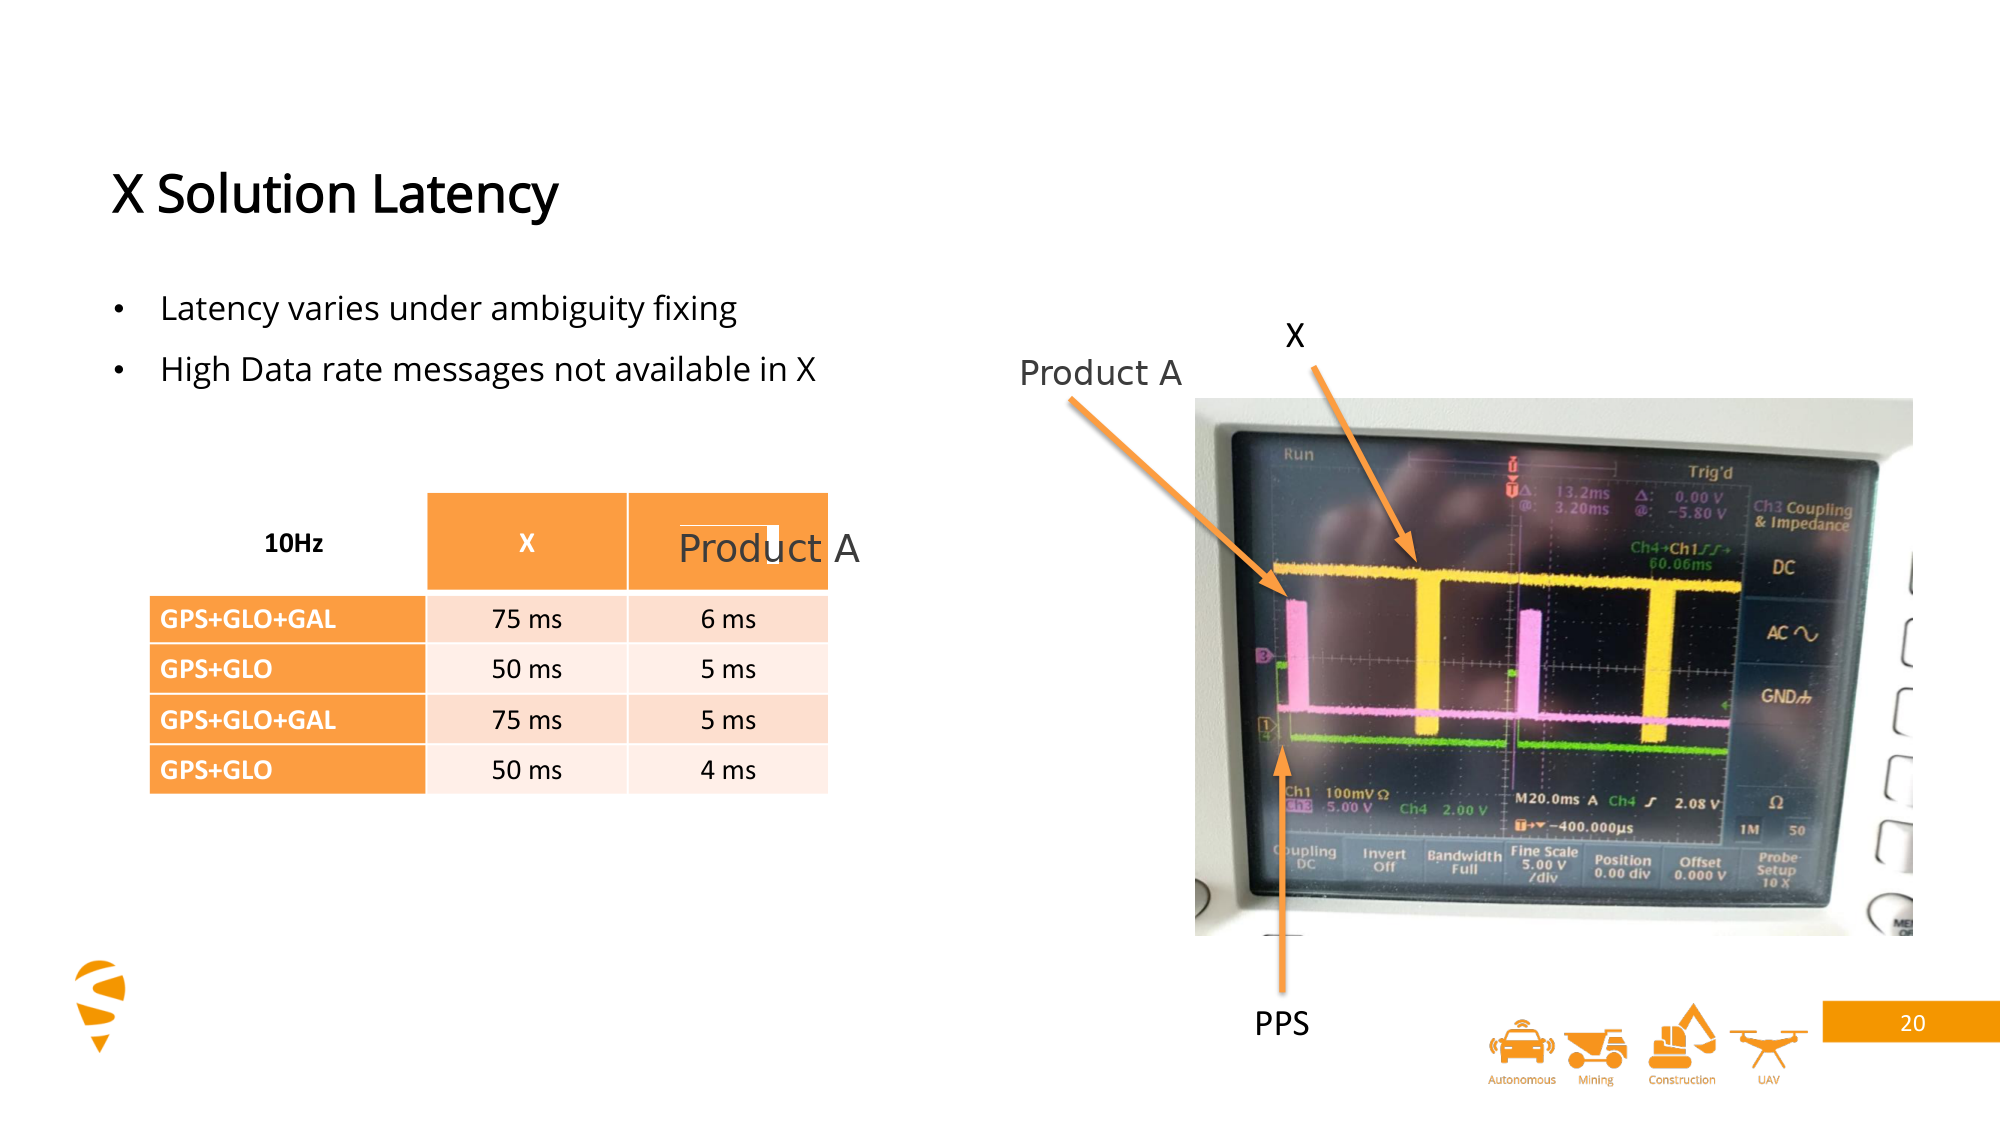
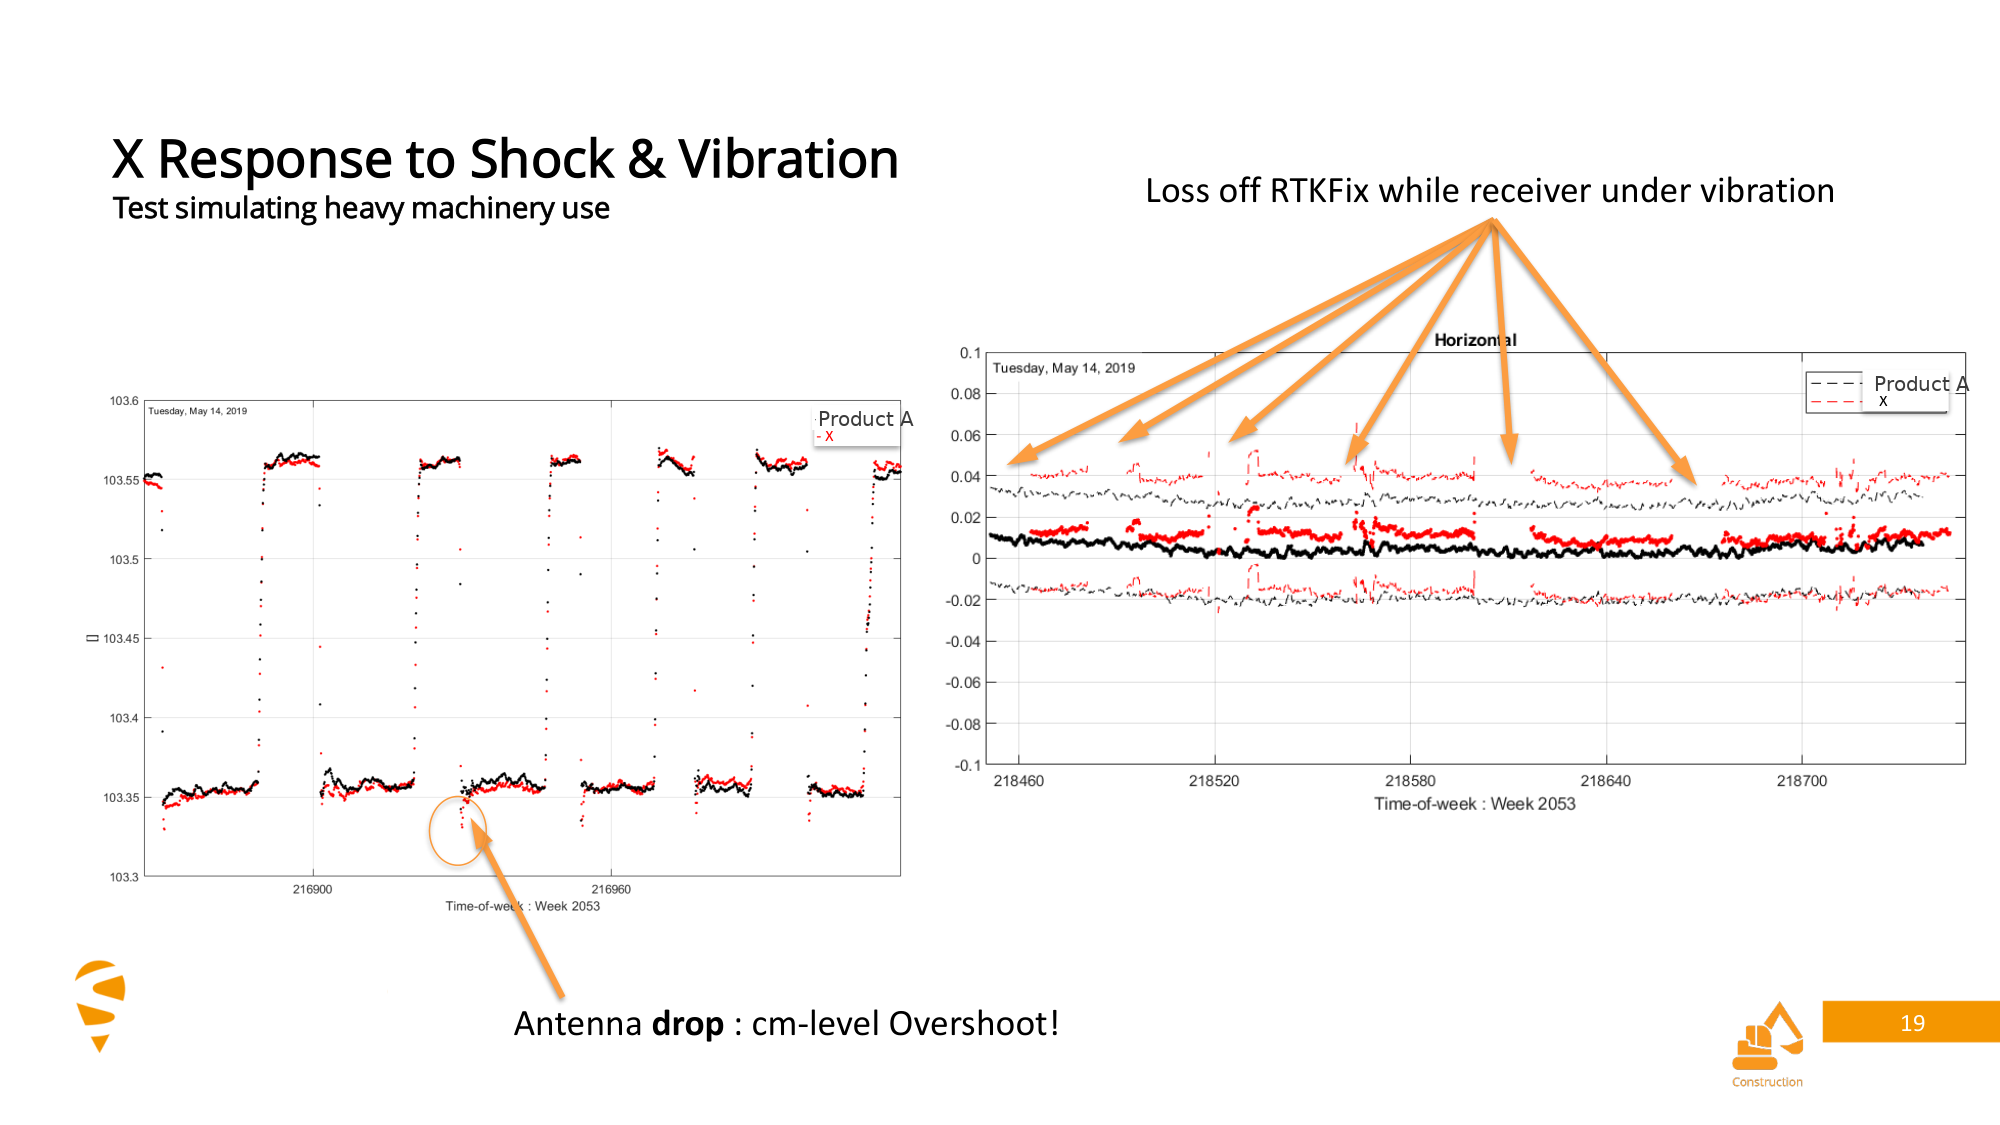
What the charts show: with the car parked near a building, the mosaic-X5 stayed in RTK fixed for practically the whole test, while the other receiver (Product B, shown as “X”) spent 15.7% of the time in RTK float and lost its fix after 1 h 45 min. Between buildings, the other receiver was in float 72.5% of the time, needed more than an hour to reach an RTK fix and badly understated its float error. At 10 Hz its output latency was 50–75 ms against 4–6 ms for the mosaic-X5. In a shock and vibration test simulating heavy machinery it repeatedly lost its RTK fix, and under rising interference it lost RTK once carrier-to-noise fell to about 35 dB-Hz.
3. Dynamic Field Test
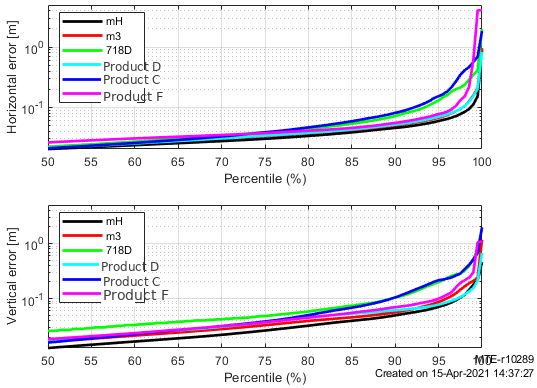
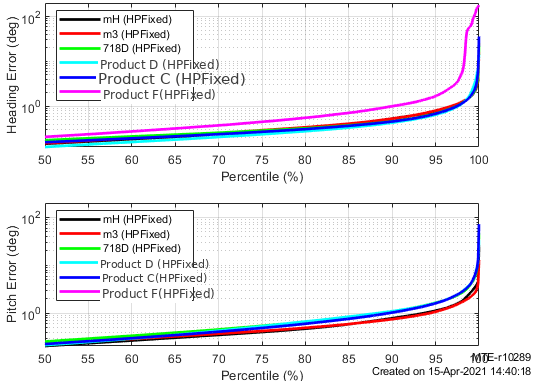
The third campaign drove the receivers along city streets, elevated roads and river crossings, and recorded PVT error, attitude error, signal reacquisition and PVT re-initialisation behaviour.
What the charts show: the statistics below compare position and attitude error along the route, and how quickly each receiver reacquired satellites and re-initialised its solution after passing under elevated roads and bridges, the conditions a road vehicle or delivery robot meets every day.

4. Conclusions
- Output latency and jitter: the mosaic-X5 engine inside the HB56 stayed below 5 ms average latency in both modes, with maximum jitter under 1.5 ms — the lowest of the receivers tested. Most receivers showed higher latency and jitter in RTK mode than in SPP mode.
- Update rate: the HB56’s mosaic-X5 engine supported up to 100 Hz, against roughly 10 Hz for the other receivers in the same tests.
- Reliability: the mosaic-X5 outperformed the other receivers in the same batch on static and dynamic RTK availability, error-reporting consistency, shock and vibration, and interference rejection.
- These conclusions are limited to the receivers, methods and scope of the three test documents listed below.
5. Data Sources
- 1: PVT Output Latency and Jitter Test (Septentrio NV)
- 2: Static and Dynamic Reliability Test (Septentrio NV)
- 3: Dynamic Field Test (Septentrio NV)
6. Test Method and Definitions
Test method (source 1): an oscilloscope was connected simultaneously to the receiver’s PPS output and serial TX pin, measuring the interval between the PPS pulse and delivery of the PVT message. 1,000 consecutive cycles were measured, and average latency, maximum latency and maximum jitter were computed.
Definitions: update rate is the number of solution outputs per unit time (100 Hz corresponds to a 10 ms period); output latency is the time from the measurement epoch until the data is available; jitter is the maximum change between the current value and the previous second’s value. Latency and jitter are reported separately.
7. Frequently Asked Questions
What is GNSS output latency and what is jitter?
Output latency is the time from the measurement epoch to the moment the position solution is available at the receiver's output. Jitter is the maximum change between the current value and the previous second's value. Latency determines how up to date a control loop's correction is; jitter determines how predictable that correction is. The two are reported separately throughout this article.
Why is RTK latency usually higher than SPP latency?
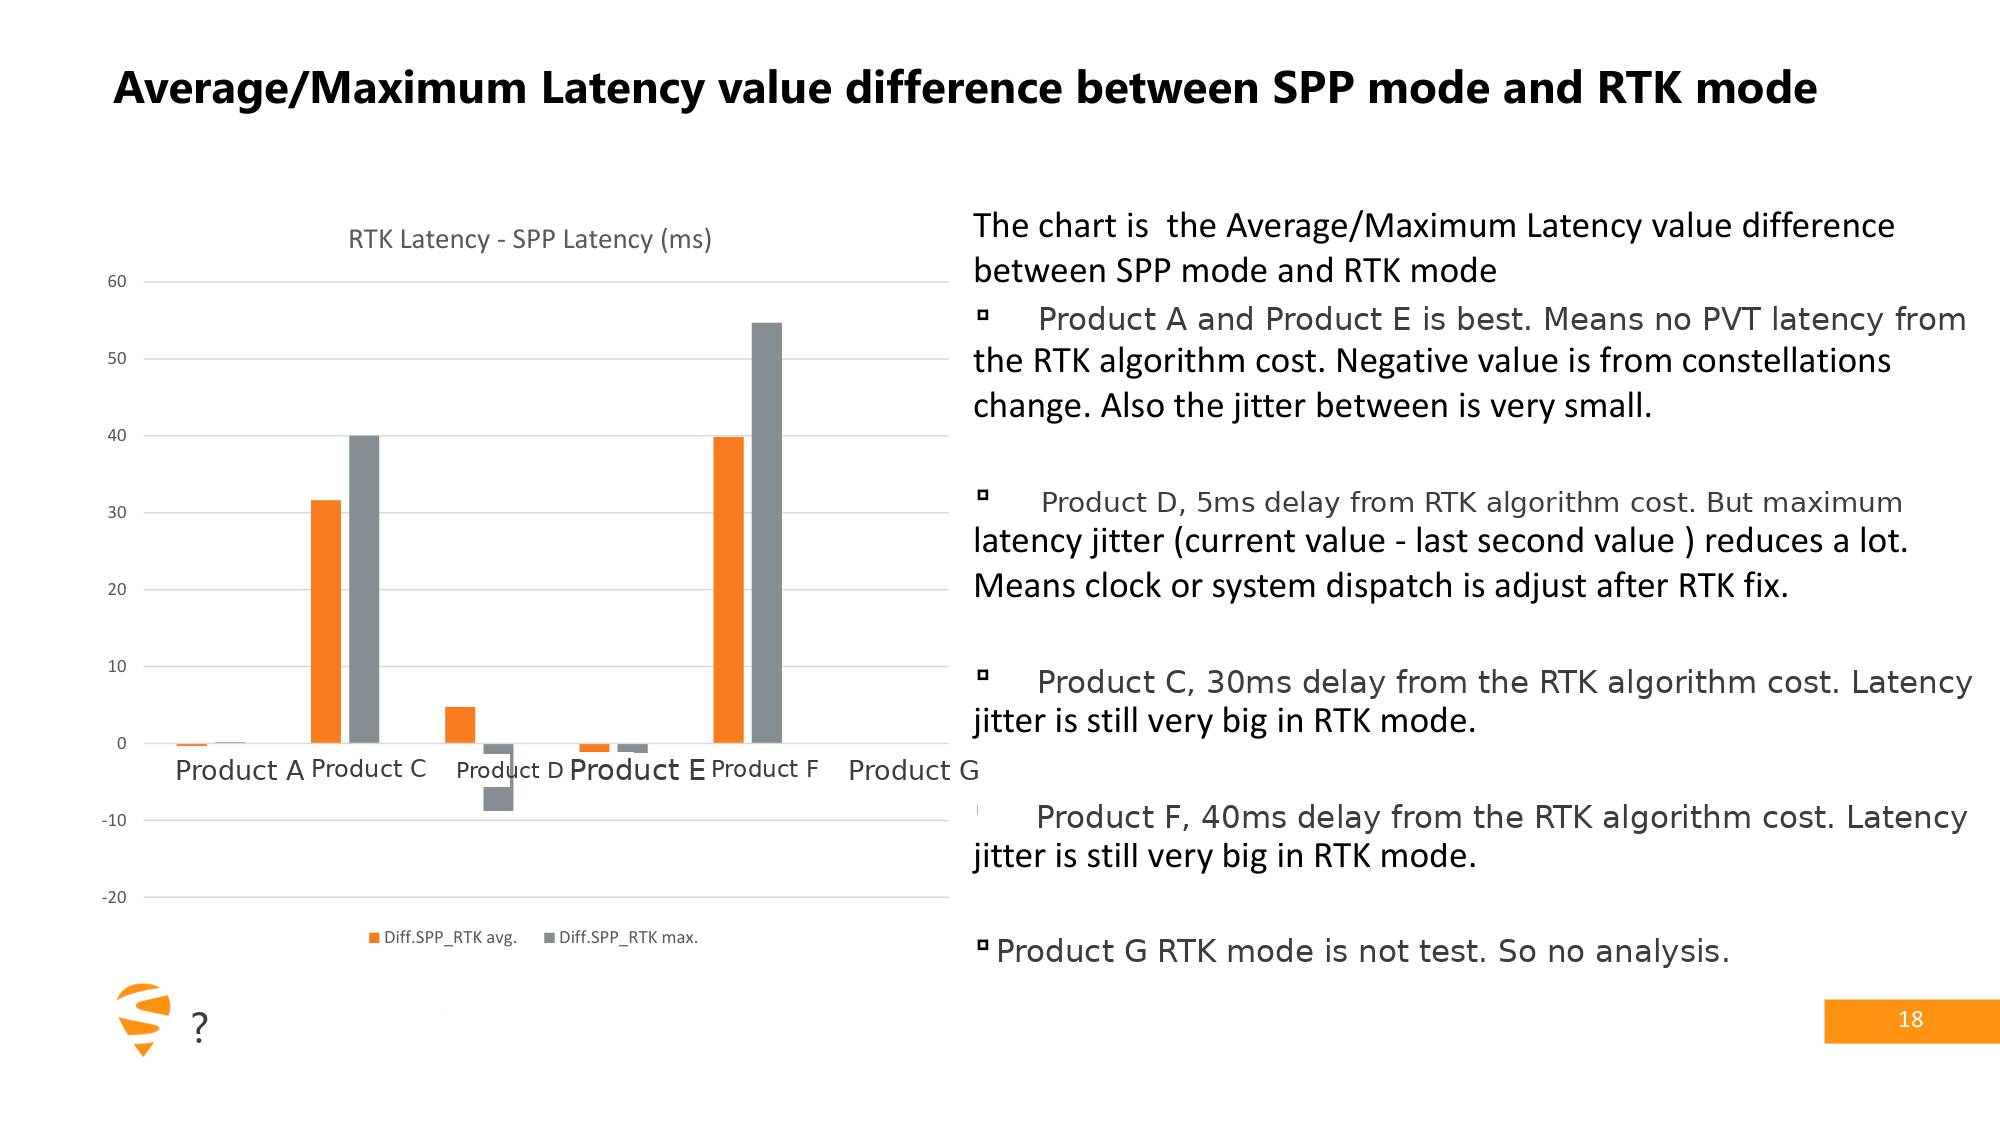
RTK requires differential corrections and an integer ambiguity resolution step, which adds computation before the solution can be released. When ambiguity fixing is not stable the solve time varies from epoch to epoch, which amplifies jitter. In these tests Product C and Product F both showed markedly higher latency and jitter in RTK mode than in SPP mode for exactly this reason.
What does a 100 Hz update rate give you on a drone or a robot?
100 Hz means a new solution every 10 ms, so a flight controller or motion controller receives position feedback ten times faster than at 10 Hz. That reduces control lag in fast manoeuvres and in sensor-fusion loops. The mosaic-X5 engine inside the HB56 supported up to 100 Hz output in these tests, against roughly 10 Hz for the other receivers in the same tests.
How was output latency measured?
With an oscilloscope connected simultaneously to the receiver's PPS output and its serial TX pin, measuring the interval between the PPS pulse and the arrival of the PVT message. 1,000 consecutive cycles were captured for each configuration, and average latency, maximum latency and maximum jitter were computed.
How did the HB56’s mosaic-X5 engine perform on interference and vibration?
In the static and dynamic reliability campaign, Product A outperformed the other receivers in the same batch on RTK availability, error-reporting consistency, resistance to shock and vibration, and interference rejection. Under rising interference power it kept its carrier-to-noise ratio and its RTK fix.
Which Eview receiver delivers low latency and a high update rate?
The Eview HB56 is the receiver in this class. It is a flange-mount RTK GNSS receiver, powered by the Septentrio mosaic-X5, that outputs position at up to 100 Hz with under 10 ms latency and reaches 0.6 cm + 0.5 ppm horizontal RTK accuracy. It also logs raw measurements to an on-board SD card. The HB56H adds dual-antenna heading in the same housing.
8. Related Eview GNSS Products
The latency, jitter and update-rate numbers above depend on the receiver firmware and baseband. These Eview products cover the applications in this report:
- Eview HB56 – RTK GNSS receiver with SD card logging — Septentrio mosaic-X5 inside: 100 Hz output with under 10 ms latency, 0.6 cm + 0.5 ppm RTK, AIM+ anti-jamming, OSNMA anti-spoofing and on-board SD logging
- Eview HB56H – GNSS heading receiver with SD logging — Adds dual-antenna heading (0.15 degrees at 1 m baseline) and pitch or roll, with RTK position and attitude output together at up to 20 Hz
- GNSS receiver box range — Flange-mount receivers for vehicles, robots, vessels and equipment panels
- GNSS boards and OEM modules — Mosaic-X5, Mosaic-G5 and mosaic-H boards if you are integrating the receiver into your own hardware
Not sure which receiver fits your control loop? Email us a short description of your application and we will come back with a specific recommendation, or see our contact page.
Related Reading
- GNSS Receiver RFQ: Buyer's Checklist for the Right Quote
- Septentrio RAIM+ Explained: GNSS Integrity Monitoring
- GNSS Timing Under Jamming: Why PPS Shifts and How to Stop It
- RTK GNSS for Construction Machine Control
Sources & References
Author: Jack W. · Published: 15 October 2026
Source: Septentrio NV test presentation covering three campaigns (PVT output latency and jitter; static and dynamic reliability; dynamic field test), shared with Eview GNSS and published with Septentrio’s permission. All test figures, slide images and table values are reproduced from that material; images © Septentrio NV. Septentrio mosaic-X5: septentrio.com/mosaic-x5.
Notes: Product A to Product G (also shown as “X” in some slides) are Septentrio’s codes for the receivers under test; competing models are not named. Product A is the Septentrio mosaic-X5 module, the GNSS engine inside the Eview HB56, HB6 and HB62. The tests were run on the module, not on a finished Eview receiver.