mosaic-X5 Standalone vs SBAS Accuracy: 30-Minute Test Data
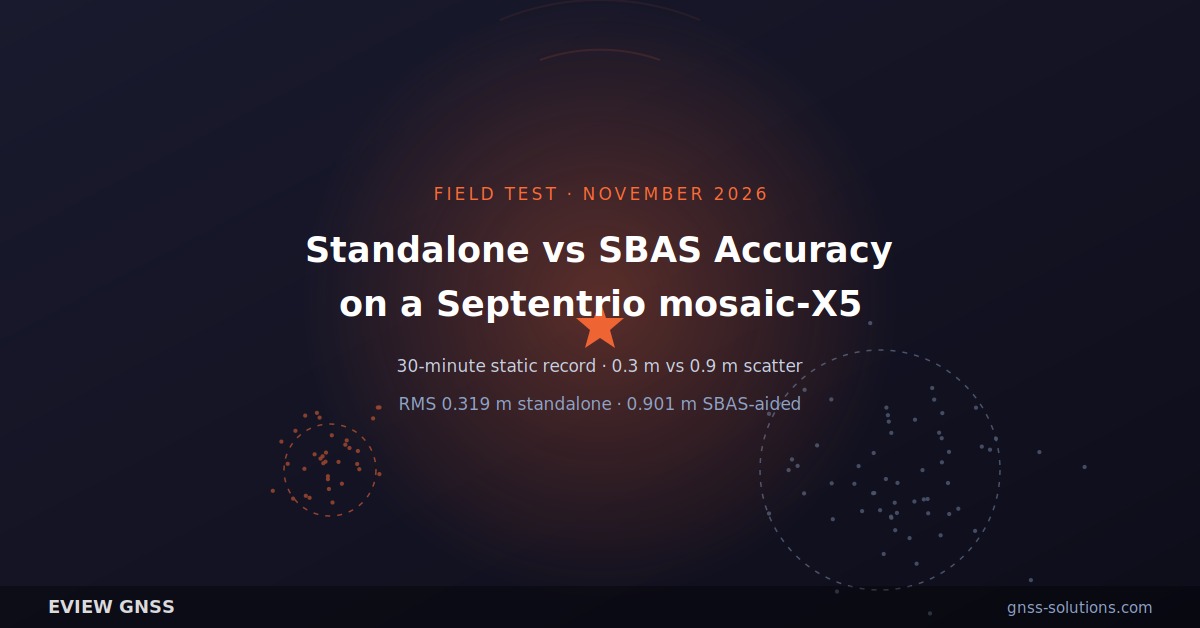
Short answer: a 30-minute static test of a Septentrio mosaic-X5 on a rooftop in Shenzhen produced a standalone horizontal scatter of roughly 0.3 m and an SBAS-aided scatter of roughly 0.9 m — the augmentation made the fix worse, not better. Septentrio’s summary statistics put RMS at 0.319 m standalone and 0.901 m SBAS-aided. Both numbers beat or miss the datasheet figures (1.2 m standalone, 0.6 m SBAS), and neither is an RTK result. If you need better than a metre in China, SBAS is not the lever — RTK is.
This article walks through the test setup, the measured scatter, the summary statistics supplied with it, and the reason an augmentation system can degrade a fix. The receiver under test is the Septentrio mosaic-X5 module; the Eview HB56 is built on the same module, so the numbers transfer directly to a finished receiver of ours.
Running this configuration yourself? Talk to an engineer about the module, the antenna chain and the correction source before you buy: sales@gnss-solutions.com — request a quote or a spec review.
What this test measured — and what it did not
The test recorded two 15-minute windows from one receiver at one position: standalone positioning first, then SBAS positioning. It is a static, single-point, single-observation record. There is no surveyed truth coordinate, the original raw logs were not retained, and the antenna model, gain and cable loss were not logged. The site was a rooftop with partial sky obstruction, not the open-sky condition the datasheet’s accuracy figures assume.
That combination makes the numbers useful as a relative comparison of two positioning modes on the same hardware, and unsuitable as a headline accuracy claim. We report them the way the source report does.
Test setup: one receiver, two 15-minute windows
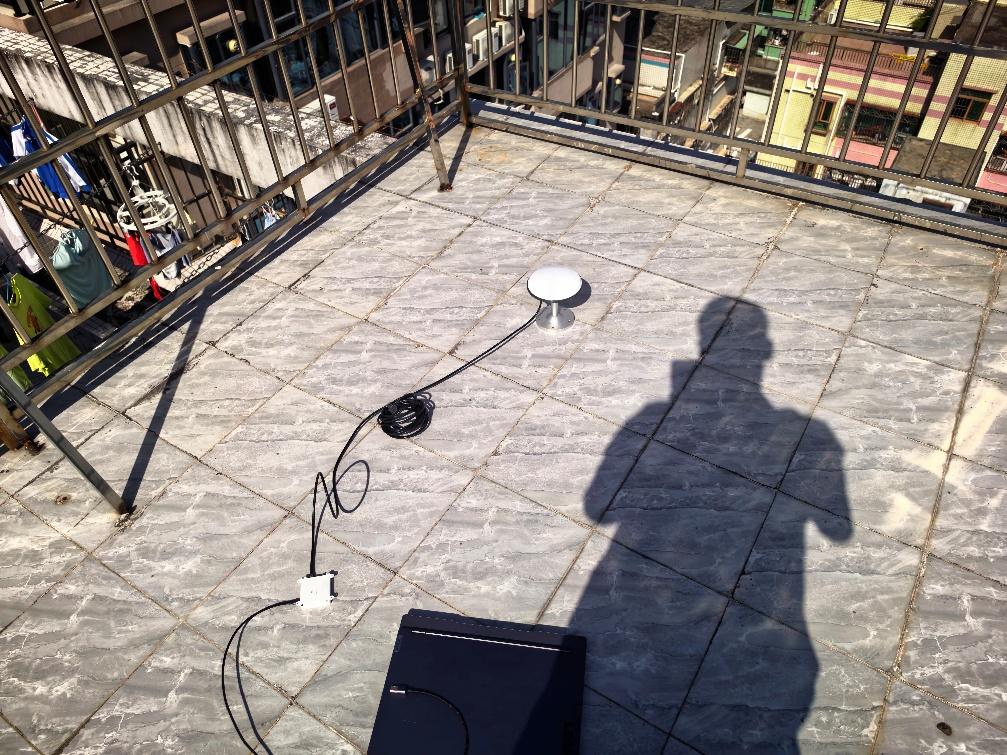
The device was a Septentrio mosaic-X5 module running firmware 4.15.1, fed by a survey antenna through a short cable run. The site was in Shenzhen (22.5°N, 114.0°E) on a rooftop with partial obstruction, and the observation ran from 10:30 to 11:00 local time.
The two windows do not start from the same event. The standalone window starts counting at receiver power-on, so it includes the first-fix interval — the datasheet gives under 45 s cold start and under 20 s warm start. The SBAS window starts counting only once the receiver reports an SBAS solution. Any comparison between the two therefore carries a small structural advantage for SBAS, which makes its worse result more notable, not less.
Standalone results: about 0.3 m scatter, 0.319 m RMS
Fifteen minutes of standalone fixes produced a tight cluster. Read off the scatter plot, the mean deviation is around 0.3 m; the summary statistics supplied with the test put the mean horizontal error at 0.262 m, RMS at 0.319 m and median error at 0.246 m, over 1,915 samples.
Set that against the datasheet: 1.2 m horizontal RMS in open sky. The measured scatter is roughly a quarter of that figure — on a site with obstruction, which normally hurts rather than helps. A result like that is plausible for a good antenna and a clean RF environment, and it is exactly why one static observation cannot be treated as a specification: nothing here separates antenna quality from multipath from satellite geometry.
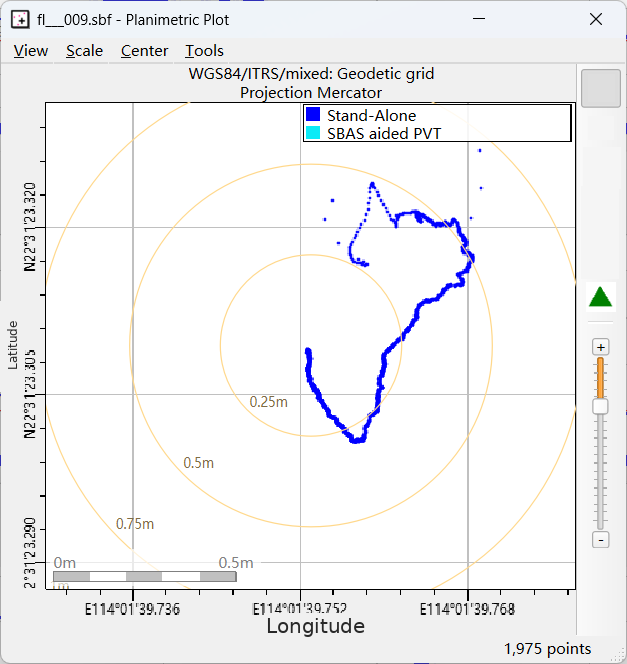
SBAS results: about 0.9 m scatter, 0.901 m RMS
Fifteen minutes of SBAS-aided fixes produced a visibly looser cluster: around 0.9 m mean deviation by eye, with summary statistics of 0.772 m mean error, 0.901 m RMS and 0.974 m median, over 1,620 samples. Against a datasheet figure of 0.6 m SBAS horizontal RMS, the measurement came out roughly 50% worse than specified — and about three times worse than the standalone window on the same hardware, antenna and sky.
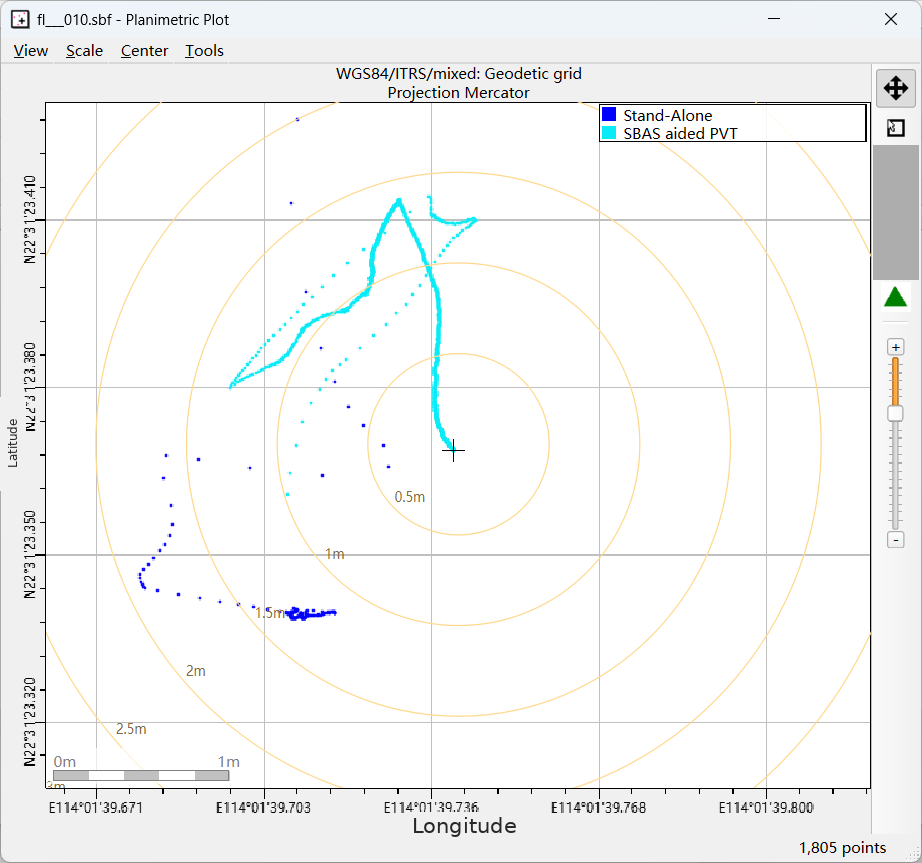
Summary statistics supplied with the test
The test package included the tabulated comparison below. We reproduce it because it is the only quantitative layer in the source material: the scatter readings are visual, these are computed. The source report does not describe the processing settings or the reference point used, so treat the two columns as internally comparable, not as calibrated absolute accuracy.
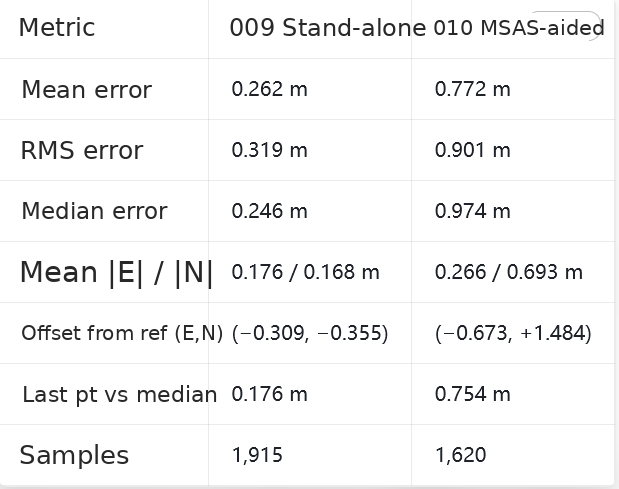
| Metric (horizontal) | Stand-alone | SBAS-aided (MSAS) |
|---|---|---|
| Mean error | 0.262 m | 0.772 m |
| RMS error | 0.319 m | 0.901 m |
| Median error | 0.246 m | 0.974 m |
| Mean per-axis |E| / |N| | 0.176 / 0.168 m | 0.266 / 0.693 m |
| Offset from reference (E, N) | (−0.309, −0.355) | (−0.673, +1.484) |
| Last point vs segment median | 0.176 m | 0.754 m |
| Samples | 1,915 | 1,620 |
Datasheet specification next to the measurement
For reference, the mosaic-X5 datasheet (BBR 66/07/2025) lists the following horizontal and vertical figures, all RMS in open sky — a stricter and more useful basis than a scatter plot read by eye.
| Mode | Horizontal | Vertical | Condition |
|---|---|---|---|
| Stand-alone | 1.2 m | 1.9 m | RMS, open sky |
| SBAS | 0.6 m | 0.8 m | RMS, open sky |
| DGNSS | 0.4 m | 0.7 m | RMS, open sky |
| RTK | 0.6 cm + 0.5 ppm | 1 cm + 1 ppm | Baseline under 40 km |
Two of the four modes were exercised. RTK — the mode most buyers actually want — was not tested here; the RTK line in that table is a specification, not a measurement.
Why SBAS made the fix worse: it is not the receiver’s SBAS
The mosaic-X5 supports EGNOS, WAAS, GAGAN, MSAS and SDCM. In Shenzhen the only one of those within reach is MSAS — Japan’s Multi-functional Satellite Augmentation System, whose aviation service area is the Fukuoka FIR. MSAS has been broadcast from QZS-3 (127°E, PRN 137) since April 2020 and, since October 2025, from two GEO satellites providing LPV250 service at 25 Japanese airports.
Performance at the edge of a service area is not the same product as performance at its centre. Published 2011 figures for MSAS LPV availability show 90.6% at Usuda in Japan against 49.4% at Daejeon in Korea, with the gap attributed to distance from the service-area centre — and MSAS is not certified for Korean territory at all. Shenzhen is substantially further from the MSAS core than Daejeon. The test report could not obtain Fukuoka FIR boundary coordinates and therefore stopped short of declaring the site out of area; the honest statement is that the site sits in China while the augmentation in use is Japanese.
There is also an ionospheric layer to this. Southern China sits in a low-latitude region where ionospheric gradients are steep; published research on SBAS in India put 5°×5° grid interpolation error at up to 27 m slant range for low-elevation satellites. The test did not record ionospheric indices or separate that contribution, so the 0.9 m figure carries an unquantified ionospheric component.
The augmentation China actually has — and why this module can’t use it
China’s own SBAS is BDSBAS, broadcasting single-frequency corrections on BDSBAS-B1C and dual-frequency multi-constellation corrections on BDSBAS-B2a from GEO slots at 80°E, 110.5°E and 140°E. The mosaic-X5 datasheet does not list BDSBAS support, and neither does the product page. So the one augmentation service that would help at this site is not available on this receiver, and the one augmentation the receiver can see is designed for a neighbouring country’s airspace.
The BDSBAS performance numbers are real where the hardware supports it: a 2024 single-frequency trial at the JFNG station in Wuhan reported accuracy improvements of 39.87% in East, 63.53% in North and 63.08% in Up. That result requires a BDSBAS-B1C capable receiver, which the mosaic-X5 is not.
What to do instead: use RTK, not SBAS, for sub-metre work
The practical conclusion from this test is simple. For metre-level work in China, standalone on a good antenna is already around 1 m and an unusable augmentation will not improve it. For sub-metre work, the answer is RTK: a local base or an NTRIP service, with the receiver in RTK mode, which is specified at centimetre level and does not depend on a foreign GEO footprint.
If you are buying hardware for this market, check two things before you commit: whether the receiver documents BDSBAS-B1C support if you intend to rely on augmentation, and whether your accuracy requirement is metre-level (standalone is fine) or centimetre-level (you need RTK either way). Eview HB56 (mosaic-X5) uses the same Septentrio mosaic-X5 module tested here, so these results apply to it directly; the mosaic-X5 receiver page has the module-level detail, and the OEM board range covers the integration path.
Eview receivers built on the mosaic-X5
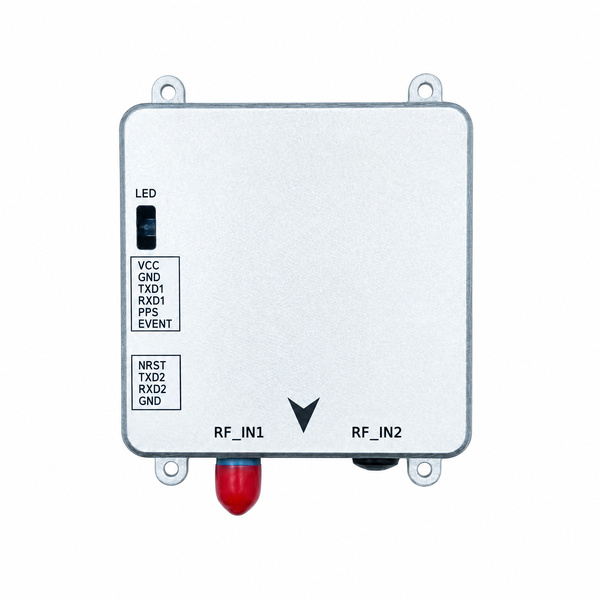
Eview HB56 (mosaic-X5) – the module tested here in a finished, flange-mount metal receiver: up to 100 Hz with <10 ms latency, RTK at 0.6 cm + 0.5 ppm, AIM+ anti-jamming and on-board SD logging for raw data.
- HB6 (mosaic-X5) – compact 45 g receiver with USB-C and microSD, for drones.
- HB56H (mosaic-H) – same housing as the HB56, adds dual-antenna heading.
- HB62 base receiver – your own RTK base, the step this test shows you need for sub-metre work.
Datasheet or quote: sales@gnss-solutions.com
Frequently asked questions
Is 0.3 m a valid accuracy claim for the mosaic-X5?
No. 0.3 m is a visual reading of a scatter plot from one static 15-minute window on a partially obstructed rooftop. The datasheet figure remains 1.2 m horizontal RMS in open sky. To make a claim you can publish, recompute RMS, CEP50 and CEP95 from the raw log against a known coordinate — which this test did not retain.
Why did SBAS come out worse than standalone?
Because the only SBAS visible from Shenzhen is MSAS, whose service area is the Fukuoka FIR over Japan. Corrections applied from outside their design area can add error rather than remove it. The test also started the standalone clock at power-on and the SBAS clock at first SBAS fix, so SBAS had a slight timing advantage and still lost.
Does the mosaic-X5 support BDSBAS?
Not per the datasheet. The documented SBAS list is EGNOS, WAAS, GAGAN, MSAS and SDCM. BDSBAS needs B1C single-frequency or B2a dual-frequency support, which this module does not document.
Does the antenna matter more than the receiver here?
In a test like this, probably yes — and the source report did not record antenna model, gain or cable loss, so it cannot be separated. A clean antenna chain with adequate net gain is the usual reason a standalone fix lands near 0.3–0.5 m instead of 1 m.
What accuracy should I expect from a mosaic-X5 with RTK?
0.6 cm + 0.5 ppm horizontal and 1 cm + 1 ppm vertical, per datasheet, on baselines under 40 km. That is the mode to specify for surveying, machine control and drone mapping; it was outside the scope of this test.
Get a spec review before you buy
Send us your accuracy target, sky view and correction source and we will tell you whether standalone, SBAS, DGNSS or RTK is the right mode — and whether a BDSBAS-capable receiver is the right choice for your site. Email sales@gnss-solutions.com.
Original sources and references
- Septentrio – mosaic-X5 standalone vs SBAS test: data, figures (site, scatter plots) and summary statistics.
- Septentrio – mosaic-X5 product page and datasheet (accuracy specifications, supported SBAS systems).
- QZSS, Cabinet Office of Japan – MSAS service notices.
- ICAO Asia/Pacific – Updates on SBAS system and implementation status in Japan.
- ESA Navipedia – MSAS performances.
- ICAO Asia/Pacific 2011 – Ionospheric effects on SBAS performance (India).
- Performance evaluation and analysis of BDSBAS single-frequency augmentation service.
- Performance analysis of the BDSBAS-B1C message in trial operation stage (Scientific Reports, 2023).